
Fig. 7
- ID
- ZDB-IMAGE-171206-53
- Genes
- Publication
- Chang et al., 2017 - Ftr82 Is Critical for Vascular Patterning during Zebrafish Development
- All Figures
- Figures for Chang et al., 2017
|
Fig. 7
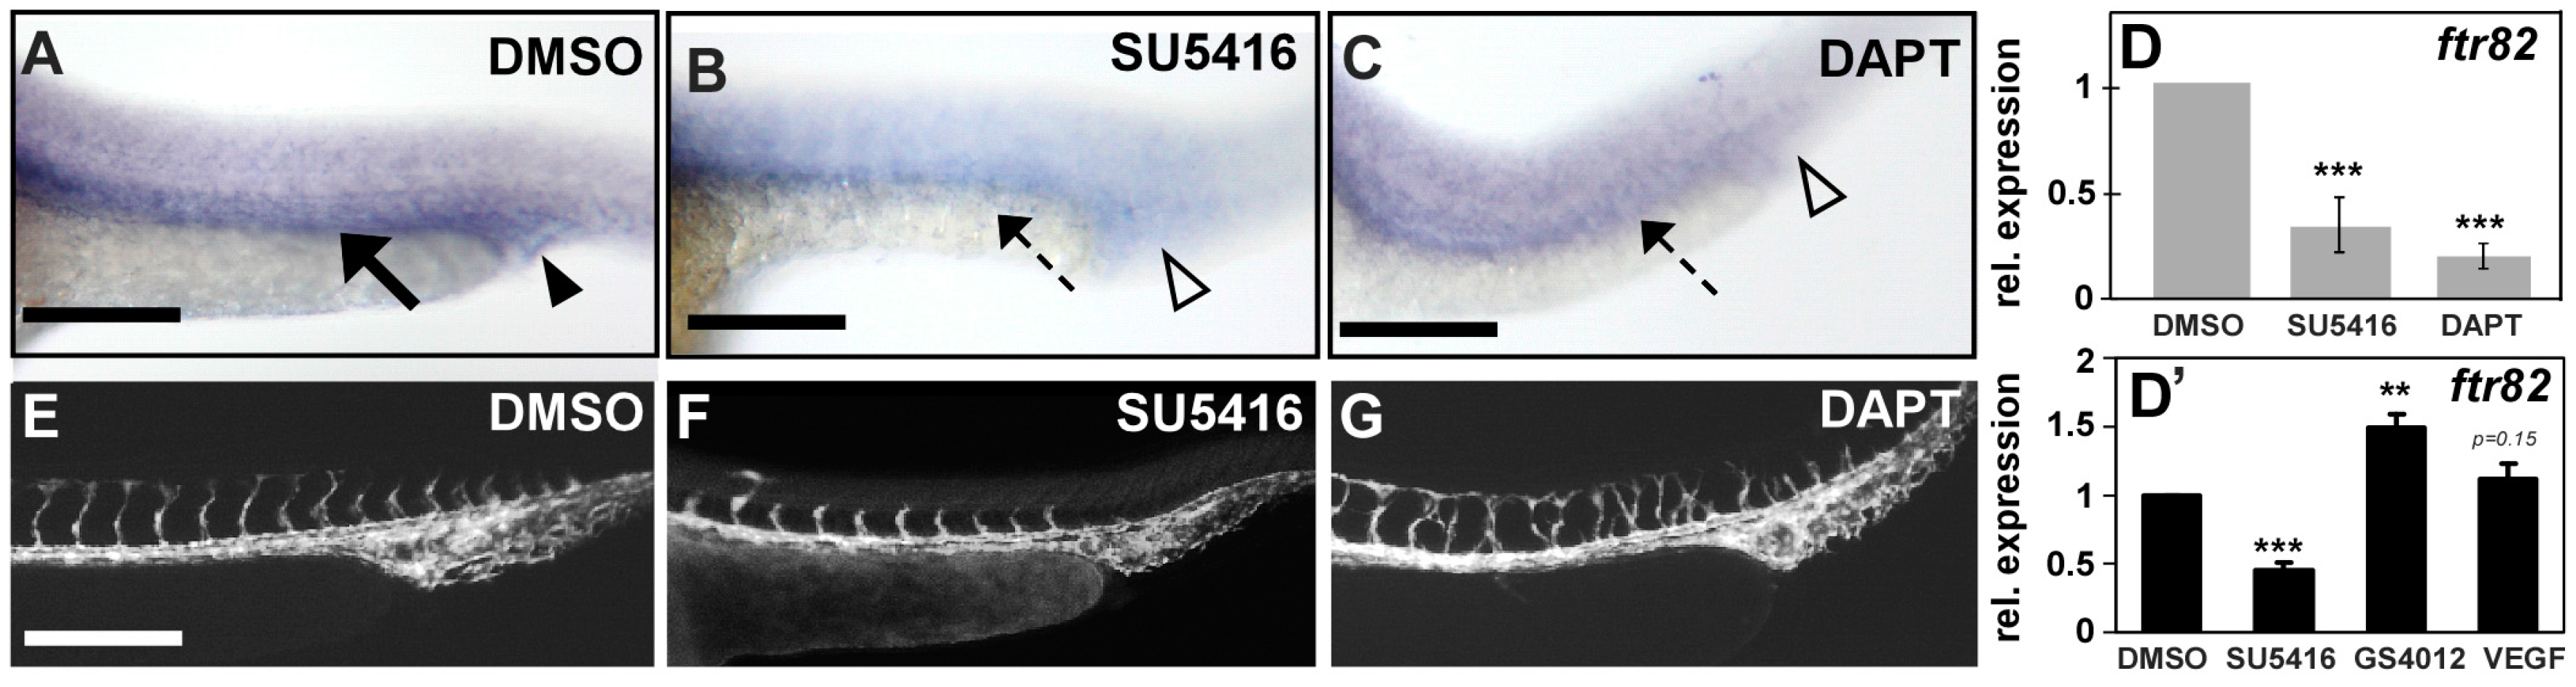
Regulation between ftr82 and VEGFR2/Notch. (A,B) ftr82 expression in vessels and CVP is reduced in VEGFR2-specific inhibitor SU5416 (10 μM)-treated embryos ((B), dashed arrow and hollow arrowhead) as compared to DMSO control embryos ((A), arrow and arrowhead); (A,C) ftr82 expression is down-regulated after treatment with Notch inactivation chemical DAPT (75 μM) ((C), dashed arrow and hollow arrowhead) as compared to DMSO control embryos (A); (D) Quantification of the relative expression level by qPCR assay showed the reduced expression of ftr82 in SU5416-treated (0.3 ± 0.18) or DAPT-treated (0.2 ± 0.1) embryos; (D’) qPCR assay showed the relative expression of ftr82 in SU5416-treated (0.5 ± 0.1), GS4012-treated (1.5 ± 0.1), or VEGF-treated (1.1 ± 0.1) embryos; (E–G) Embryos treated with 10 μM SU5416 or 75 μM DAPT showed ISV growth defects and ISV mispatterns, respectively, but vascular structure did not disappear. *** refers to p < 0.0001 and ** refers to p < 0.001 by an unpaired Student's t-test. Data are represented as means ± S.D. Scale bars represent 200 μm in (A–C,E–G).