
Fig. 6
- ID
- ZDB-IMAGE-171106-8
- Genes
- Publication
- Shu et al., 2016 - The basal function of teleost prolactin as a key regulator on ion uptake identified with zebrafish knockout models
- All Figures
- Figures for Shu et al., 2016
|
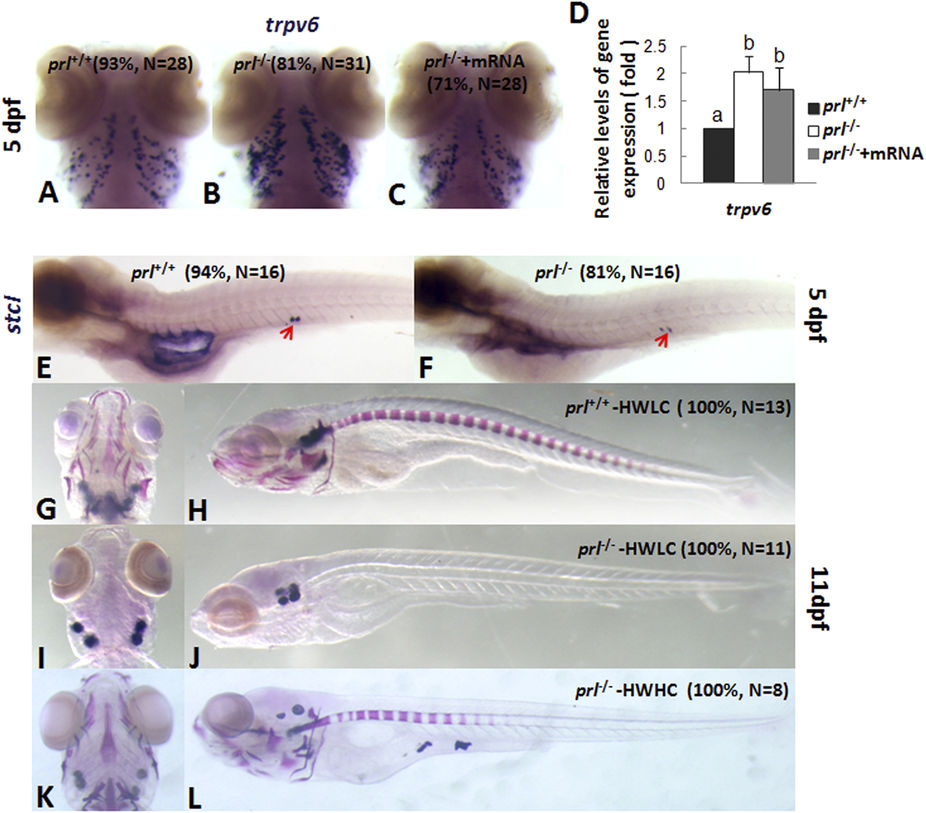
Fig. 6
Analyses of Ca2+ uptake and bone formation in prl-deficient larvae.
(A–C) Expression patterns of transient receptor potential family, vanilloid type 6 channel (trpv6) in gills of wild-type larvae (A), prl-deficient larvae (B) prl-deficient larvae embryos injected with wild-type prl mRNA larvae (C) at 5 dpf in regular zebrafish egg water. (D) qRT-PCR assay of trpv6 expression levels in the head tissue from wild-type, prl-deficient larvae and prl-deficient larvae injected with prl mRNA at 5 dpf in regular zebrafish egg water. (E,F) Expression patterns of stanniocalcin 1 (stc1) in the corpuscles of Stannius of wild-type (E) and prl-deficient larvae (F) at 5 dpf in regular zebrafish egg water. (G–L) Bone pattern assayed with the Alizarin staining for the wild type control larvae (G,H), prl-deficient larvae (I,J) in hypotonic water with low level Ca2+ added (salinity: 675 mg IOS/L, Ca2+: 71.68 mg/L), and prl-deficient larvae (K,L) in hypotonic water with high level Ca2+ added (salinity: 675 mg IOS/L, Ca2+: 143.36 mg/L) at 11 dpf. (G,I,K) dorsal views; (H,J,L) lateral views. (a,b) different letters between two groups mean significant difference (P < 0.05). Dpf, days post-fertilization; qRT-PCR, quantitative real time RT-PCR; IOS, Instant ocean salts. The qRT-PCR result shown here is the representative of the results obtained in two separate experiments. For whole mount in situ hybridization, at least 16 embryos/genotype were analyzed in two separated experiments.