
Fig. 3
- ID
- ZDB-IMAGE-171101-43
- Genes
- Publication
- Cheng et al., 2015 - Deltex1 is inhibited by the Notch-Hairy/E(Spl) signaling pathway and induces neuronal and glial differentiation
- All Figures
- Figures for Cheng et al., 2015
|
Fig. 3
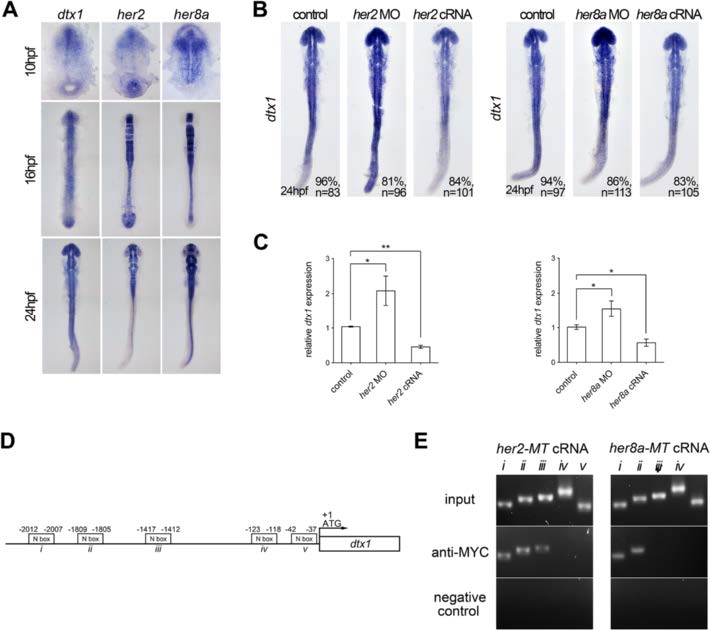
Her2 and Her8a inhibits dtx1 transcription through direct binding to the promoter region. a Comparison of the expression of dtx1 with her2 and her8a showing partially overlapped expression in the developing nervous system. b In situ hybridization result showing that her2 or her8a cRNA inhibited dtx1 expression. c qPCR results showing that her2 or her8a cRNA injection downregulated dtx1expression. *, P < 0.05; **, P < 0.01. d A schematic representation of the promoter region of dtx1, and fragments containing potential N-boxes are named and indicated. These fragments were selected for PCR amplification. e Chromatin immunoprecipitation (ChiP)–PCR analysis was performed on the bud stage embryos. Many fragments (i, ii, and iii) that were amplified by PCR suggested the direct binding of Her2 and Her8a to these regions