
Fig. 2
- ID
- ZDB-IMAGE-170921-70
- Genes
- Antibodies
- Publication
- Dash et al., 2016 - sept7b is required for the differentiation of pancreatic endocrine progenitors
- All Figures
- Figures for Dash et al., 2016
|
Fig. 2
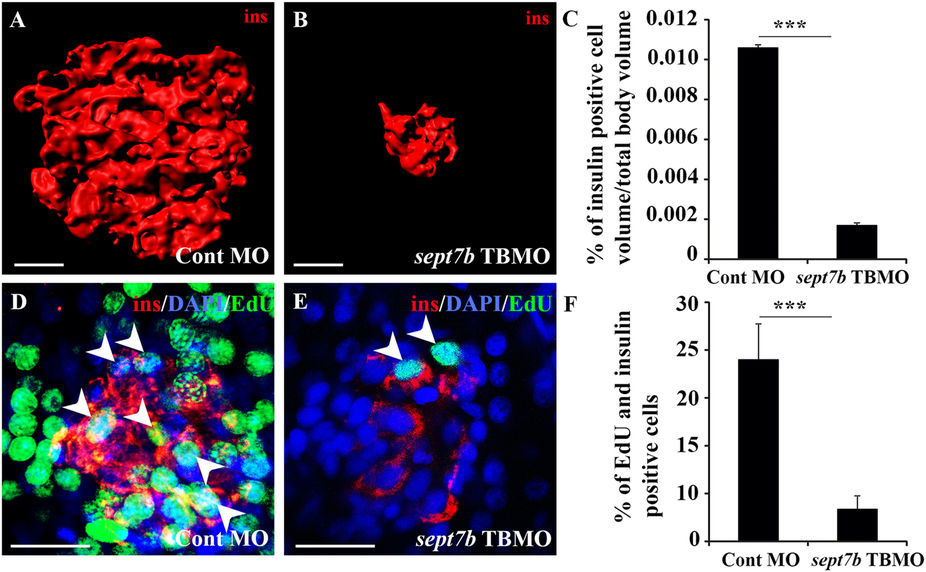
Knockdown of sept7b reduces β-cell volume and inhibits β-cell proliferation.
(A,B) Three-dimensional rendered z-stack confocal images generated from control MO-injected (A) and sept7b TBMO-injected (B) zebrafish larva at 5 dpf stained as whole mounts with antibodies against insulin. (C) Insulin-positive cell volume is significantly reduced in sept7b TBMO-injected zebrafish larvae at 5 dpf. (D,E) Three-dimensional rendered z-stack confocal images generated from control MO-injected (D) and sept7b TBMO-injected (E) zebrafish larva at 5 dpf treated with EdU (green) to visualize proliferating cells and stained with antibodies against insulin (red) to visualize β-cells. DAPI shows the nuclei (blue). Arrowheads indicate proliferating β-cells (positive for both EdU and insulin). (F) β-cell proliferation is significantly reduced in sept7b knockdown larvae. Error bars represent mean ± SEM. Scale bar (A,B) (10 μm); (D,E) (10 μm). ***p ≤ 0.0005.