
Fig. 4
- ID
- ZDB-IMAGE-170913-17
- Genes
- Publication
- Kondrychyn et al., 2017 - Transcriptional Complexity and Distinct Expression Patterns of auts2 Paralogs in Danio rerio.
- All Figures
- Figures for Kondrychyn et al., 2017
|
Fig. 4
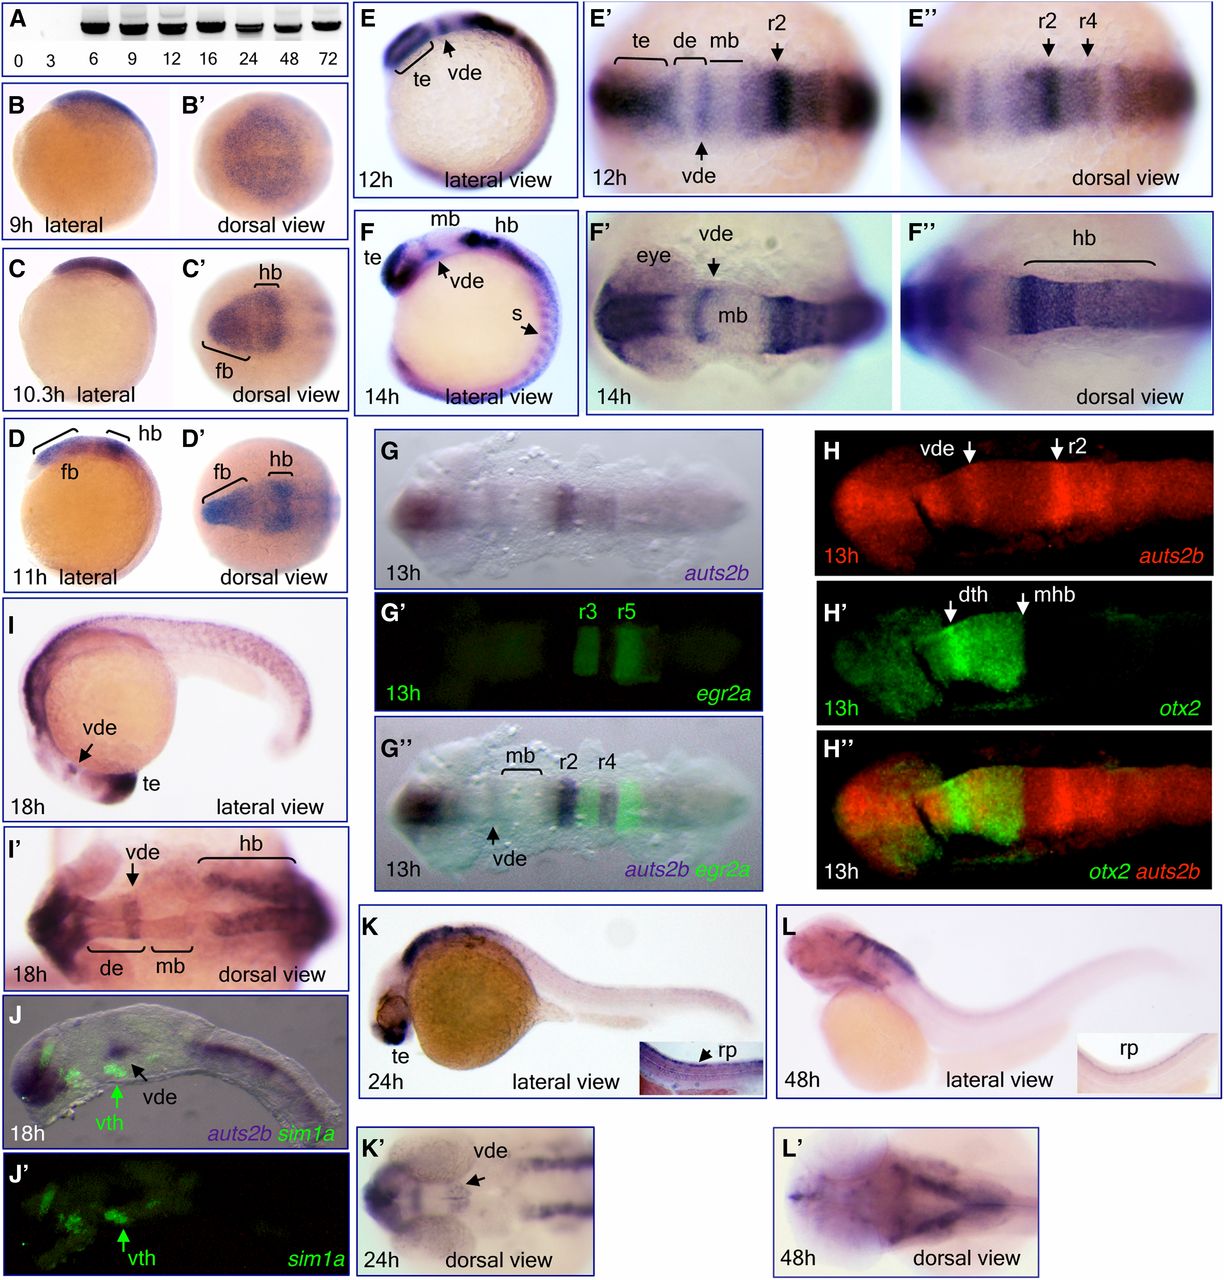
Expression of auts2b mRNA during zebrafish development. (A) RT-PCR analysis of auts2b expression during development (amplicon size is 3.25 kb). Numbers shown below each lane indicate sample age in hours post fertilization. (B–F'', I, I', and K–L'): Whole-mount in situ hybridization analysis of auts2b transcript expression in wild-type embryos at different developmental stages: 9 hr (B and B'), 10.3 hr (C and C'), 11 hr (D and D'), 12 hr (E–E''), 14 hr (F–F''), 18 hr (I and I'), 24 hr (K and K'), and 48 hr (L and L'). (G–H'', J, and J') Double in situ hybridization with egr2a (krox20) (G–G''), otx2 (H–H''), and sim1a (J and J’) as second probes. de, diencephalon; dth, dorsal thalamus; fb, forebrain; hb, hindbrain; mb, midbrain; mhb, midbrain-hindbrain boundary; r, rhombomere; rp, roof plate; RT-PCR, reverse transcription-polymerase chain reaction; s, somites; te, telencephalon; vde, ventral diencephalon; vth, ventral thalamus.