
Fig. 4
- ID
- ZDB-IMAGE-170907-49
- Genes
- Publication
- Gao et al., 2017 - The signalling receptor MCAM coordinates apical-basal polarity and planar cell polarity during morphogenesis
- All Figures
- Figures for Gao et al., 2017
|
Fig. 4
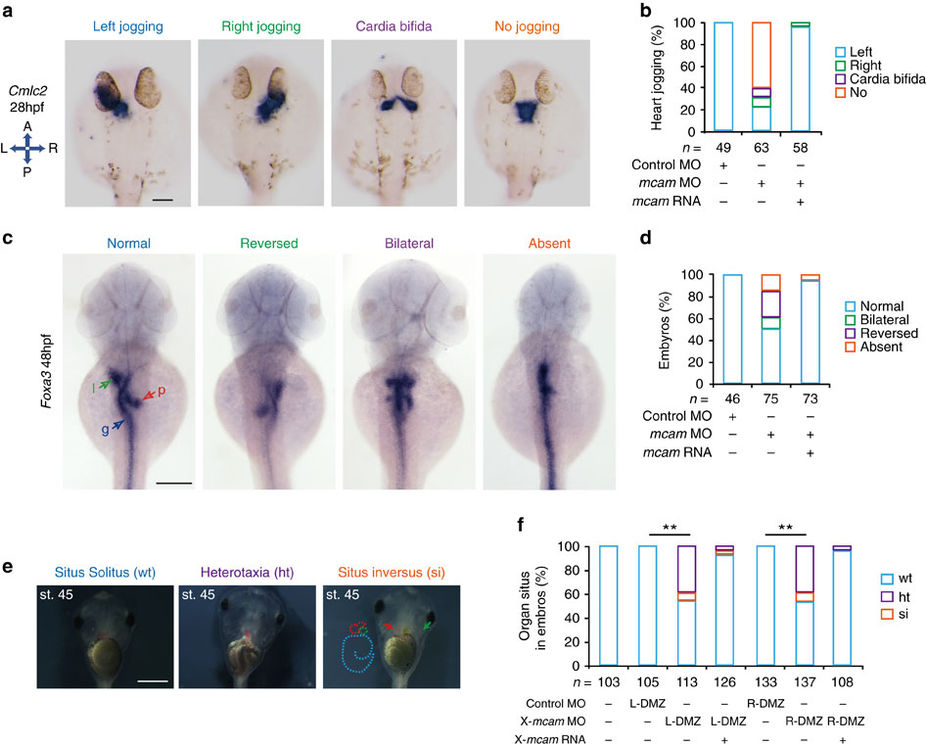
Mcam regulation of left-right asymmetric development in zebrafish and Xenopus.
(a–d) Developing organs in DFCmcam MO morphants were visualized by WISH using RNA probes of cmlc2 (a, heart) and foxa3 (c, endoderm). Quantitative analysis of embryos with normal, reversed, bilateral and absent asymmetry is shown in b,d. n, number of embryos. The left schema in a shows embryo positions in the embryo (A, anterior; P, posterior; L, left; and R, right). In c, l (green arrow)=liver, p (red arrow)=pancreas and g (blue arrow)=gut. H.p.f., hours post-fertilization. Scale bars in a,c , 100 μm. (e) Xmcam-MO (1 pM) caused situs defects at stage 45, in Xenopus embryos including heterotaxia (ht) and situs inversion (si) compared with the wild type (wt) situs solitus. Heart looping and position is outlined by red dots or red arrow, respectively. Gut coiling is outlined by light blue dots. Position of gall bladder is indicated by green auto-fluorescence and a green arrow. Scale bar, 1 mm. (f) Organ situs in Xenopus embryos at tadpole stage injected as specified. Injections were performed in left or right side of dorsal marginal zone (L- or R-DMZ) at the 4-cell stage. Data are presented as mean±s.e.m. Pearson’s chi-square tests and **P value<0.01. n, number of embryos.