
|
Fig. S1
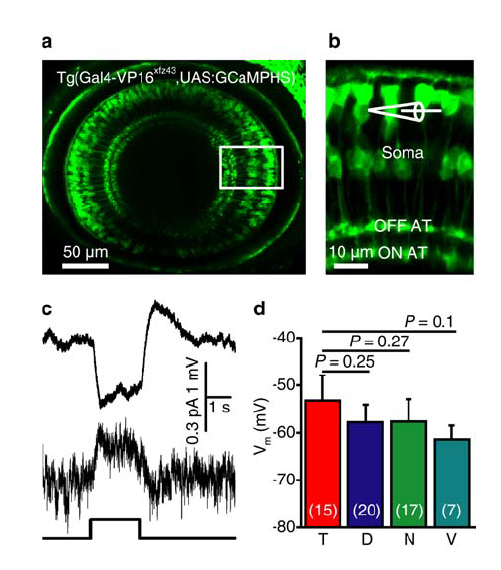
Expression of GCaMPHS in BCs and electrophysiological properties of BCs in zebrafish larvae.
(a) Confocal image showing GCaMPHS expression in BCs of a 3-dpf Tg(Gal4-VP16xfz43,UAS:GCaMPHS) larva.
(b) Enlarged view of the boxed region in (a), showing the GCaMPHS expression in the soma, axon and AT of BCs. In vivo whole-cell recording was performed on BC somata.
(c) Light-evoked responses of an OFF subtype BC in response to a 2-s flash (bottom) under current- (top) or voltage-clamp mode (middle; holding potential, -60 mV).
(d) Summary of data showing the resting membrane potentials (Vm) of BCs at four different retinal regions. The number in the brackets indicates the number of BCs examined. T, D, N and V indicate the temporal, dorsal, nasal and ventral retina, respectively.
One-way ANOVA for the data in (d). Data are represented as mean ± s.e.m.