
Fig. 2
- ID
- ZDB-IMAGE-170807-2
- Genes
- Publication
- Wu et al., 2017 - tomm22 Knockdown-Mediated Hepatocyte Damages Elicit Both the Formation of Hybrid Hepatocytes and Biliary Conversion to Hepatocytes in Zebrafish Larvae.
- All Figures
- Figures for Wu et al., 2017
|
Fig. 2
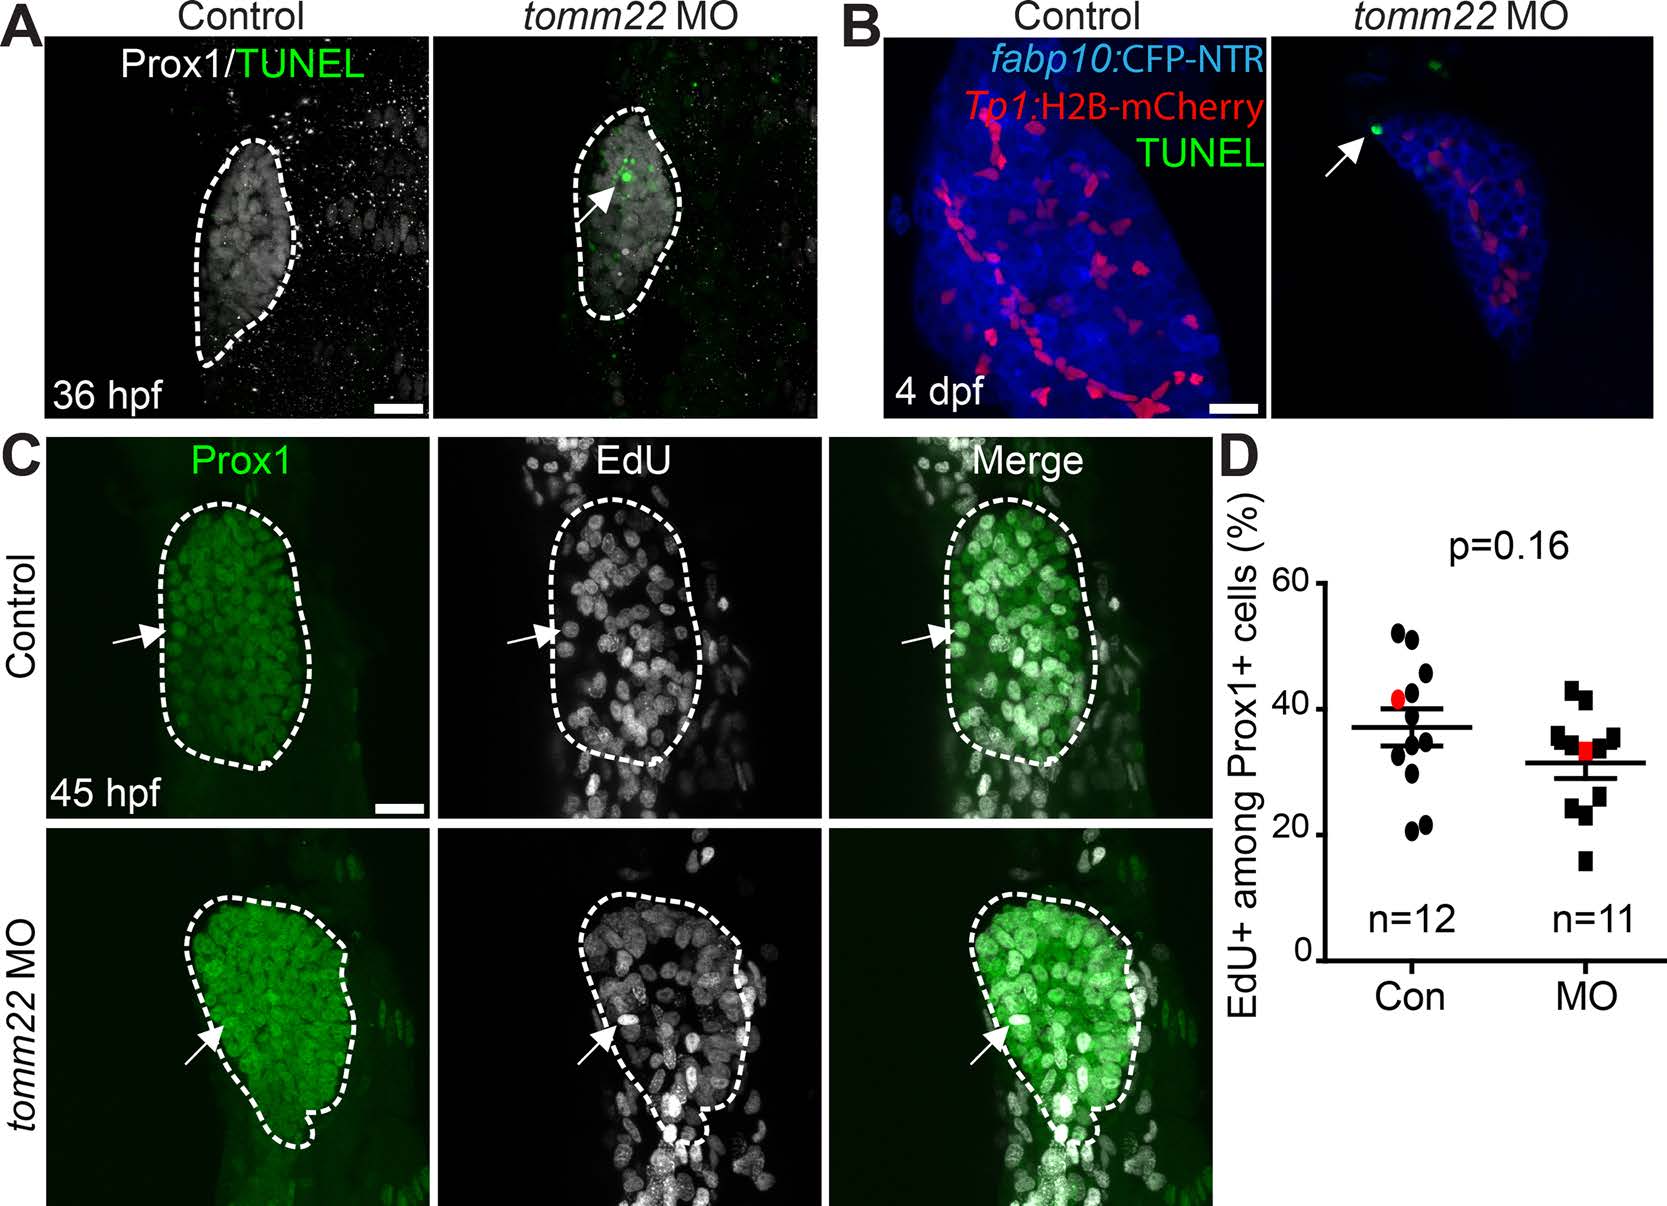
Cell death and proliferation in tomm22 MO-injected larvae. (A) Confocal projection images showing Prox1 expression (gray) and terminal deoxynucleotidyl transferase (TdT) dUTP nick-end labeling (TUNEL) (green) in the liver bud (dashed lines) at 36 h postfertilization (hpf). Arrow points to TUNEL+ cells. (B) Confocal projection images showing TUNEL (green) and the expression of fabp10a:CFP-NTR (blue) and Tp1:H2B-mCherry (red) in the liver at 4 dpf. Arrow points to TUNEL+ hepatocytes. (C) Confocal projection images showing Prox1 expression (green) and 5-ethynyl-2′-deoxyuridine (EdU) labeling (gray) in the liver (dashed lines) at 45 hpf. Arrows point to EdU/Prox1 double-positive cells. (D) Graph showing the percentage of EdU+ cells among Prox1+ cells in the liver at 45 hpf. There was no significant difference in the proliferation rate between the control and tomm22 MO-injected larvae. Red marks indicate the embryos shown in (C); n indicates the number of larvae examined. Scale bars: 20 μm; error bars: ±SEM.