
Image
|
Figure Caption
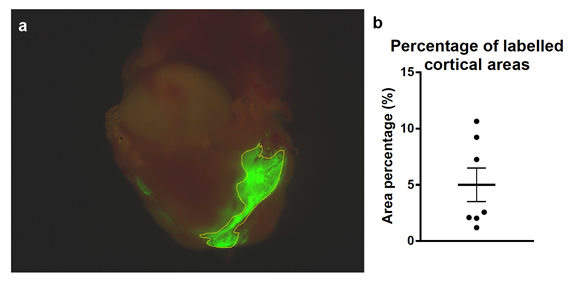
Fig. S3
Labeled cortical area size. (a) Percentages of the cortical areas were calculated from the images of whole-mount hearts by using ImageJ. (b) Individual values obtained for 7 labeled cortical areas. Calculated areas ranged from 1.2% to 11%. Mean ± SEM.
Acknowledgments
This image is the copyrighted work of the attributed author or publisher, and
ZFIN has permission only to display this image to its users.
Additional permissions should be obtained from the applicable author or publisher of the image.
Full text @ Open Biol.