
Fig. 5
- ID
- ZDB-IMAGE-170614-15
- Genes
- Publication
- Eachus et al., 2017 - Disrupted-In-Schizophrenia-1 is essential for normal hypothalamic-pituitary-interrenal (HPI) axis function
- All Figures
- Figures for Eachus et al., 2017
|
Fig. 5
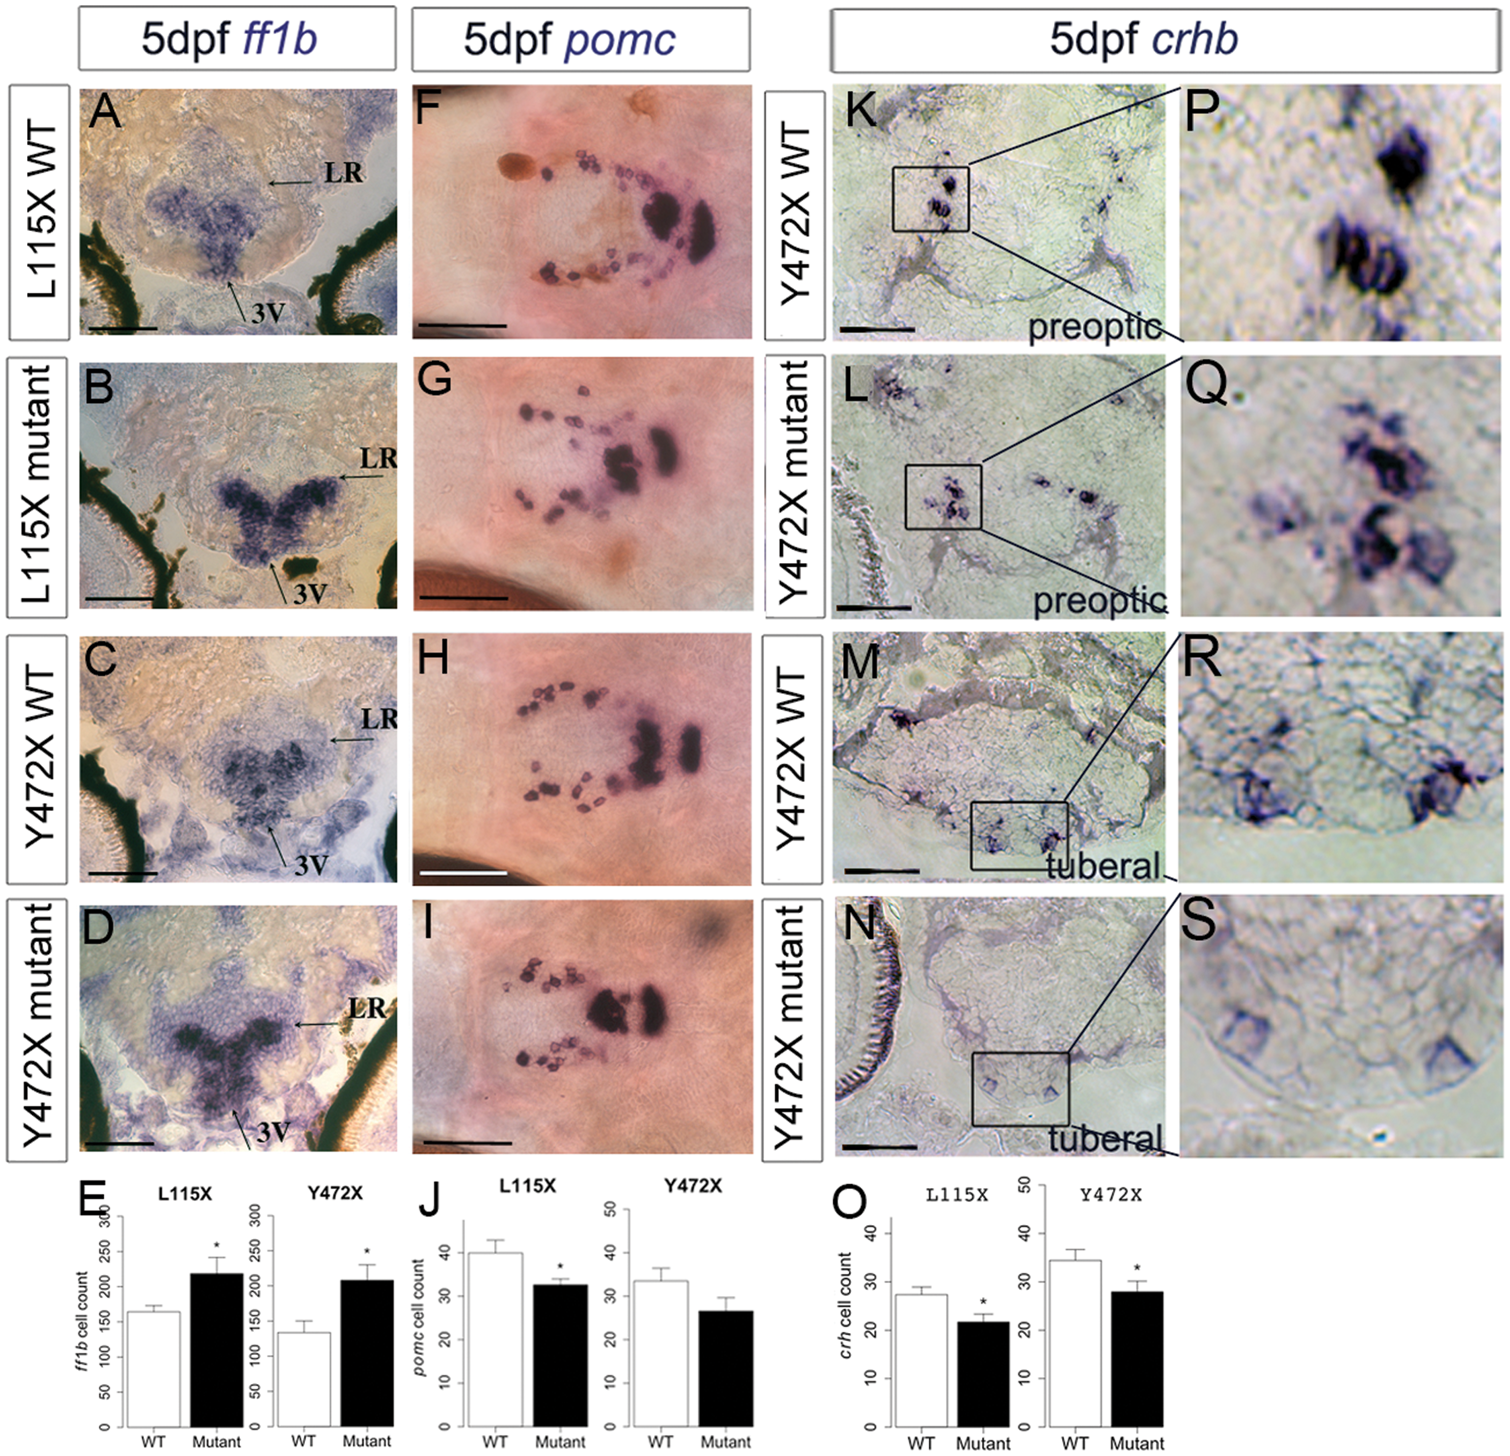
Abnormal neuronal differentiation in the hypothalamus of disc1 L115X and Y472X larvae. (A–E) Transverse sections (A–D) through posterior tuberal hypothalamus at 5 dpf after in situ hybridisation with ff1b. ff1b is expressed more strongly in both L115X and Y472X mutant larvae, and in more cells (E) compared to wild types (L115X, t test, t = −2.20, df = 11.64, P=0.049, Y472X, t test, t = −2.70, df = 12.91, P=0.018). N = 8–10 each. (F–J) Ventral whole-mount views at 5 dpf after in situ hybridisation with pomc. pomc+ cells are disorganised in the hypothalamus of mutant larvae (G,I) compared to wild type siblings (F,H). (J) Quantitative analysis at 5 dpf shows significantly fewer hypothalamic pomc+ cells in L115X (t test, t = 2.24, df = 21.52, P=0.036, N = 16) mutants compared to wild types, but no significant difference in the Y472X line (t test, t = 1.63, df = 8.79, P=0.139, N = 5–6). (K–O) Transverse sections through preoptic (K, L) or posterior tuberal hypothalamus (M,N) at 5 dpf after in situ hybridisation with crhb in the Y472X line. High power views of boxed regions show weaker expression in mutant particularly in the tuberal region (P–S). Quantitative analysis (O) shows significantly fewer crhb+ cells can be detected in the preoptic and tuberal hypothalamus of both lines mutant larvae (L115X: t test, t = −2.47, df = 21.95, P=0.022; Y472X: t test, t = −2.08, df = 23.85, P=0.049. N = 11–14 each. Abbreviations: 3V, 3rd ventricle of the hypothalamus; LR, lateral recess of the hypothalamus; WT, wild type larvae; mutant, homozygous mutant larvae. Scale bar: 50 μm.