
Fig. 7
- ID
- ZDB-IMAGE-170208-15
- Genes
- Publication
- Bielczyk-Maczyńska et al., 2015 - The Ribosome Biogenesis Protein Nol9 Is Essential for Definitive Hematopoiesis and Pancreas Morphogenesis in Zebrafish
- All Figures
- Figures for Bielczyk-Maczyńska et al., 2015
|
Fig. 7
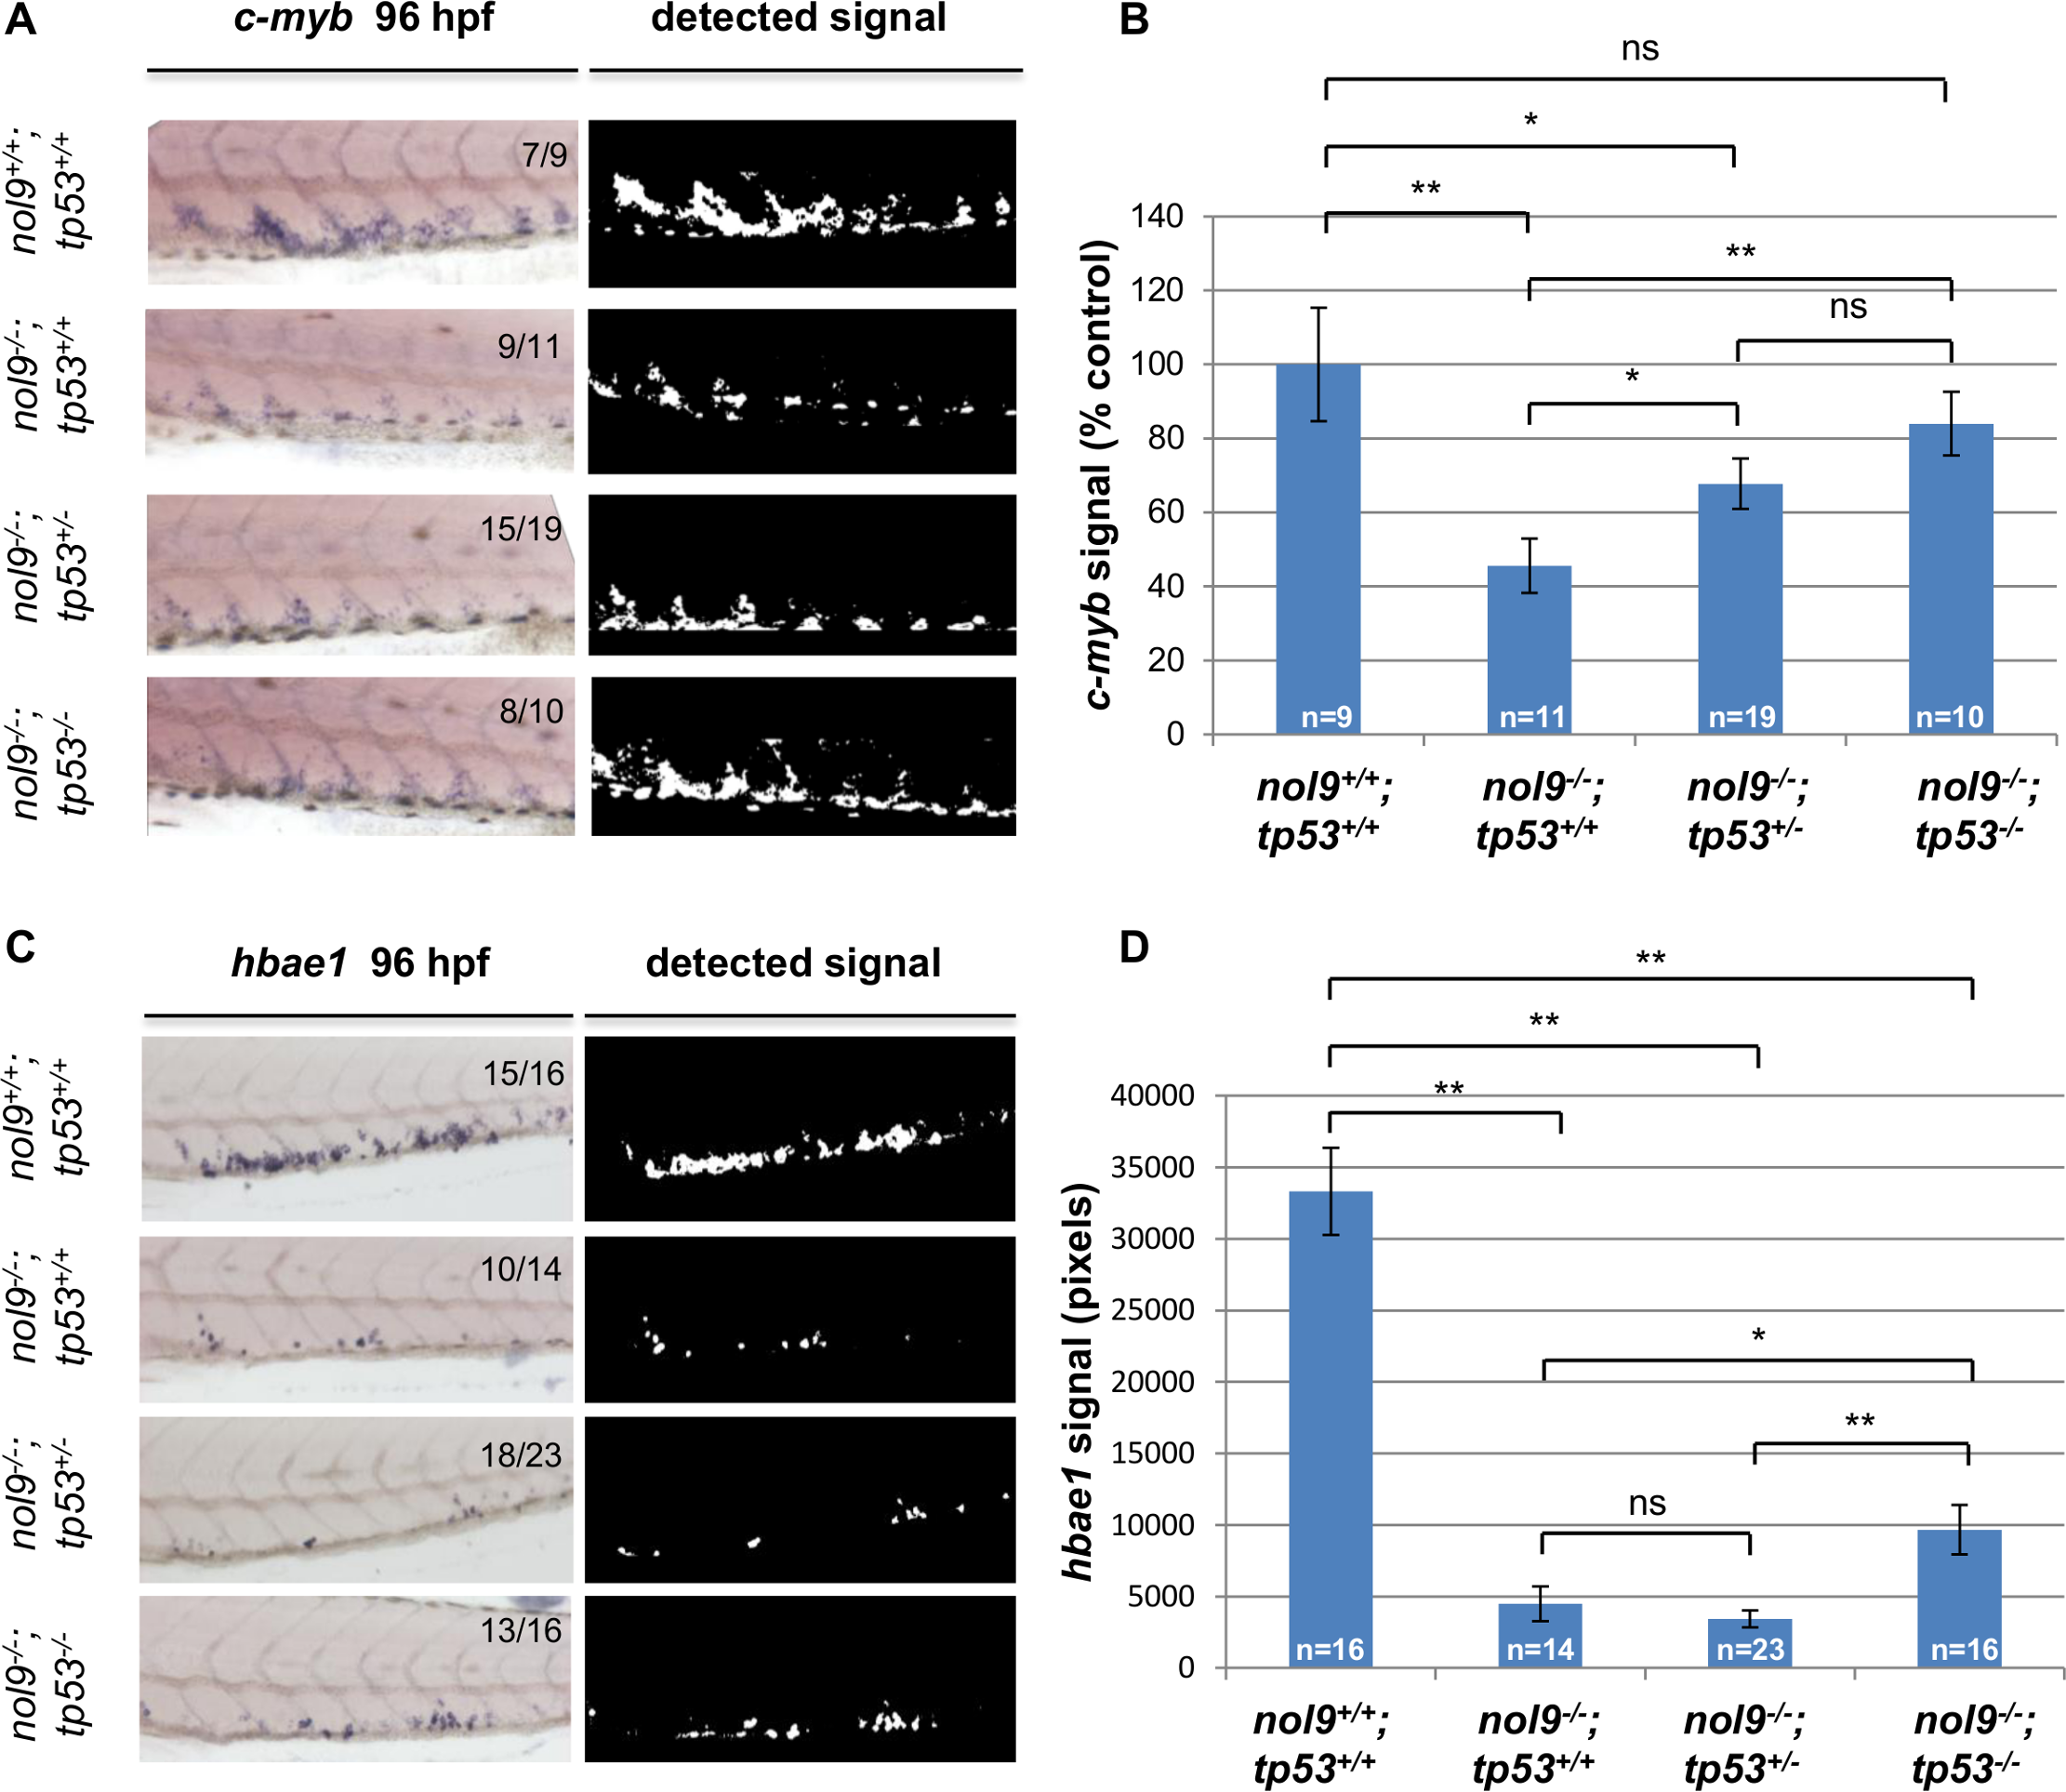
The number of HSPCs is rescued in a tp53 mutant background.
(A) The CHT of 96 hpf larvae from a nol9+/sa1022;tp53+/zdf1 x nol9+/sa1022;tp53+/zdf1 cross stained by WISH against c-myb. Signal extracted from the corresponding WISH photograph is shown. Numbers represent larvae with the displayed phenotype out of the total number of larvae examined. (B) Quantification of c-myb in situ signal for 96 hpf larvae from a nol9+/sa1022;tp53+/zdf1 x nol9+/sa1022;tp53+/zdf1 cross, depending on their genotype. Data are represented as the mean number of pixels +/- SEM. nol9+/+;tp53+/+ n = 9; nol9-/-;tp53+/+ n = 11; nol9-/-;tp53+/zdf1 n = 19; nol9-/-; tp53zdf1/zdf1 n = 10. Two-tailed Student’s t-Test, *, p<0.05; **, p<0.01. (C) Representative pictures of the CHT of 96 hpf larvae from a nol9+/sa1022;tp53+/zdf1 x nol9+/sa1022;tp53+/zdf1 cross stained by WISH against hbae1. Signal extracted from the corresponding WISH photograph is shown. (D) Quantification of hbae1 WISH signal for larvae from a nol9+/sa1022;tp53+/zdf1 x nol9+/sa1022;tp53+/zdf1 cross, depending on their genotype. Data are represented as the mean number of pixels +/- SEM. nol9+/+;tp53+/+ n = 16; nol9-/-;tp53+/+ n = 14; nol9-/-;tp53+/- n = 23; nol9-/-;tp53-/- n = 16. Two-tailed Student’s t-Test, *, p<0.05; **, p<0.01. Within the figure, nol9sa1022 allele has been denoted as nol9- and tp53zdf1 as tp53-.