
Fig. 6
- ID
- ZDB-IMAGE-170208-14
- Publication
- Bielczyk-Maczyńska et al., 2015 - The Ribosome Biogenesis Protein Nol9 Is Essential for Definitive Hematopoiesis and Pancreas Morphogenesis in Zebrafish
- All Figures
- Figures for Bielczyk-Maczyńska et al., 2015
|
Fig. 6
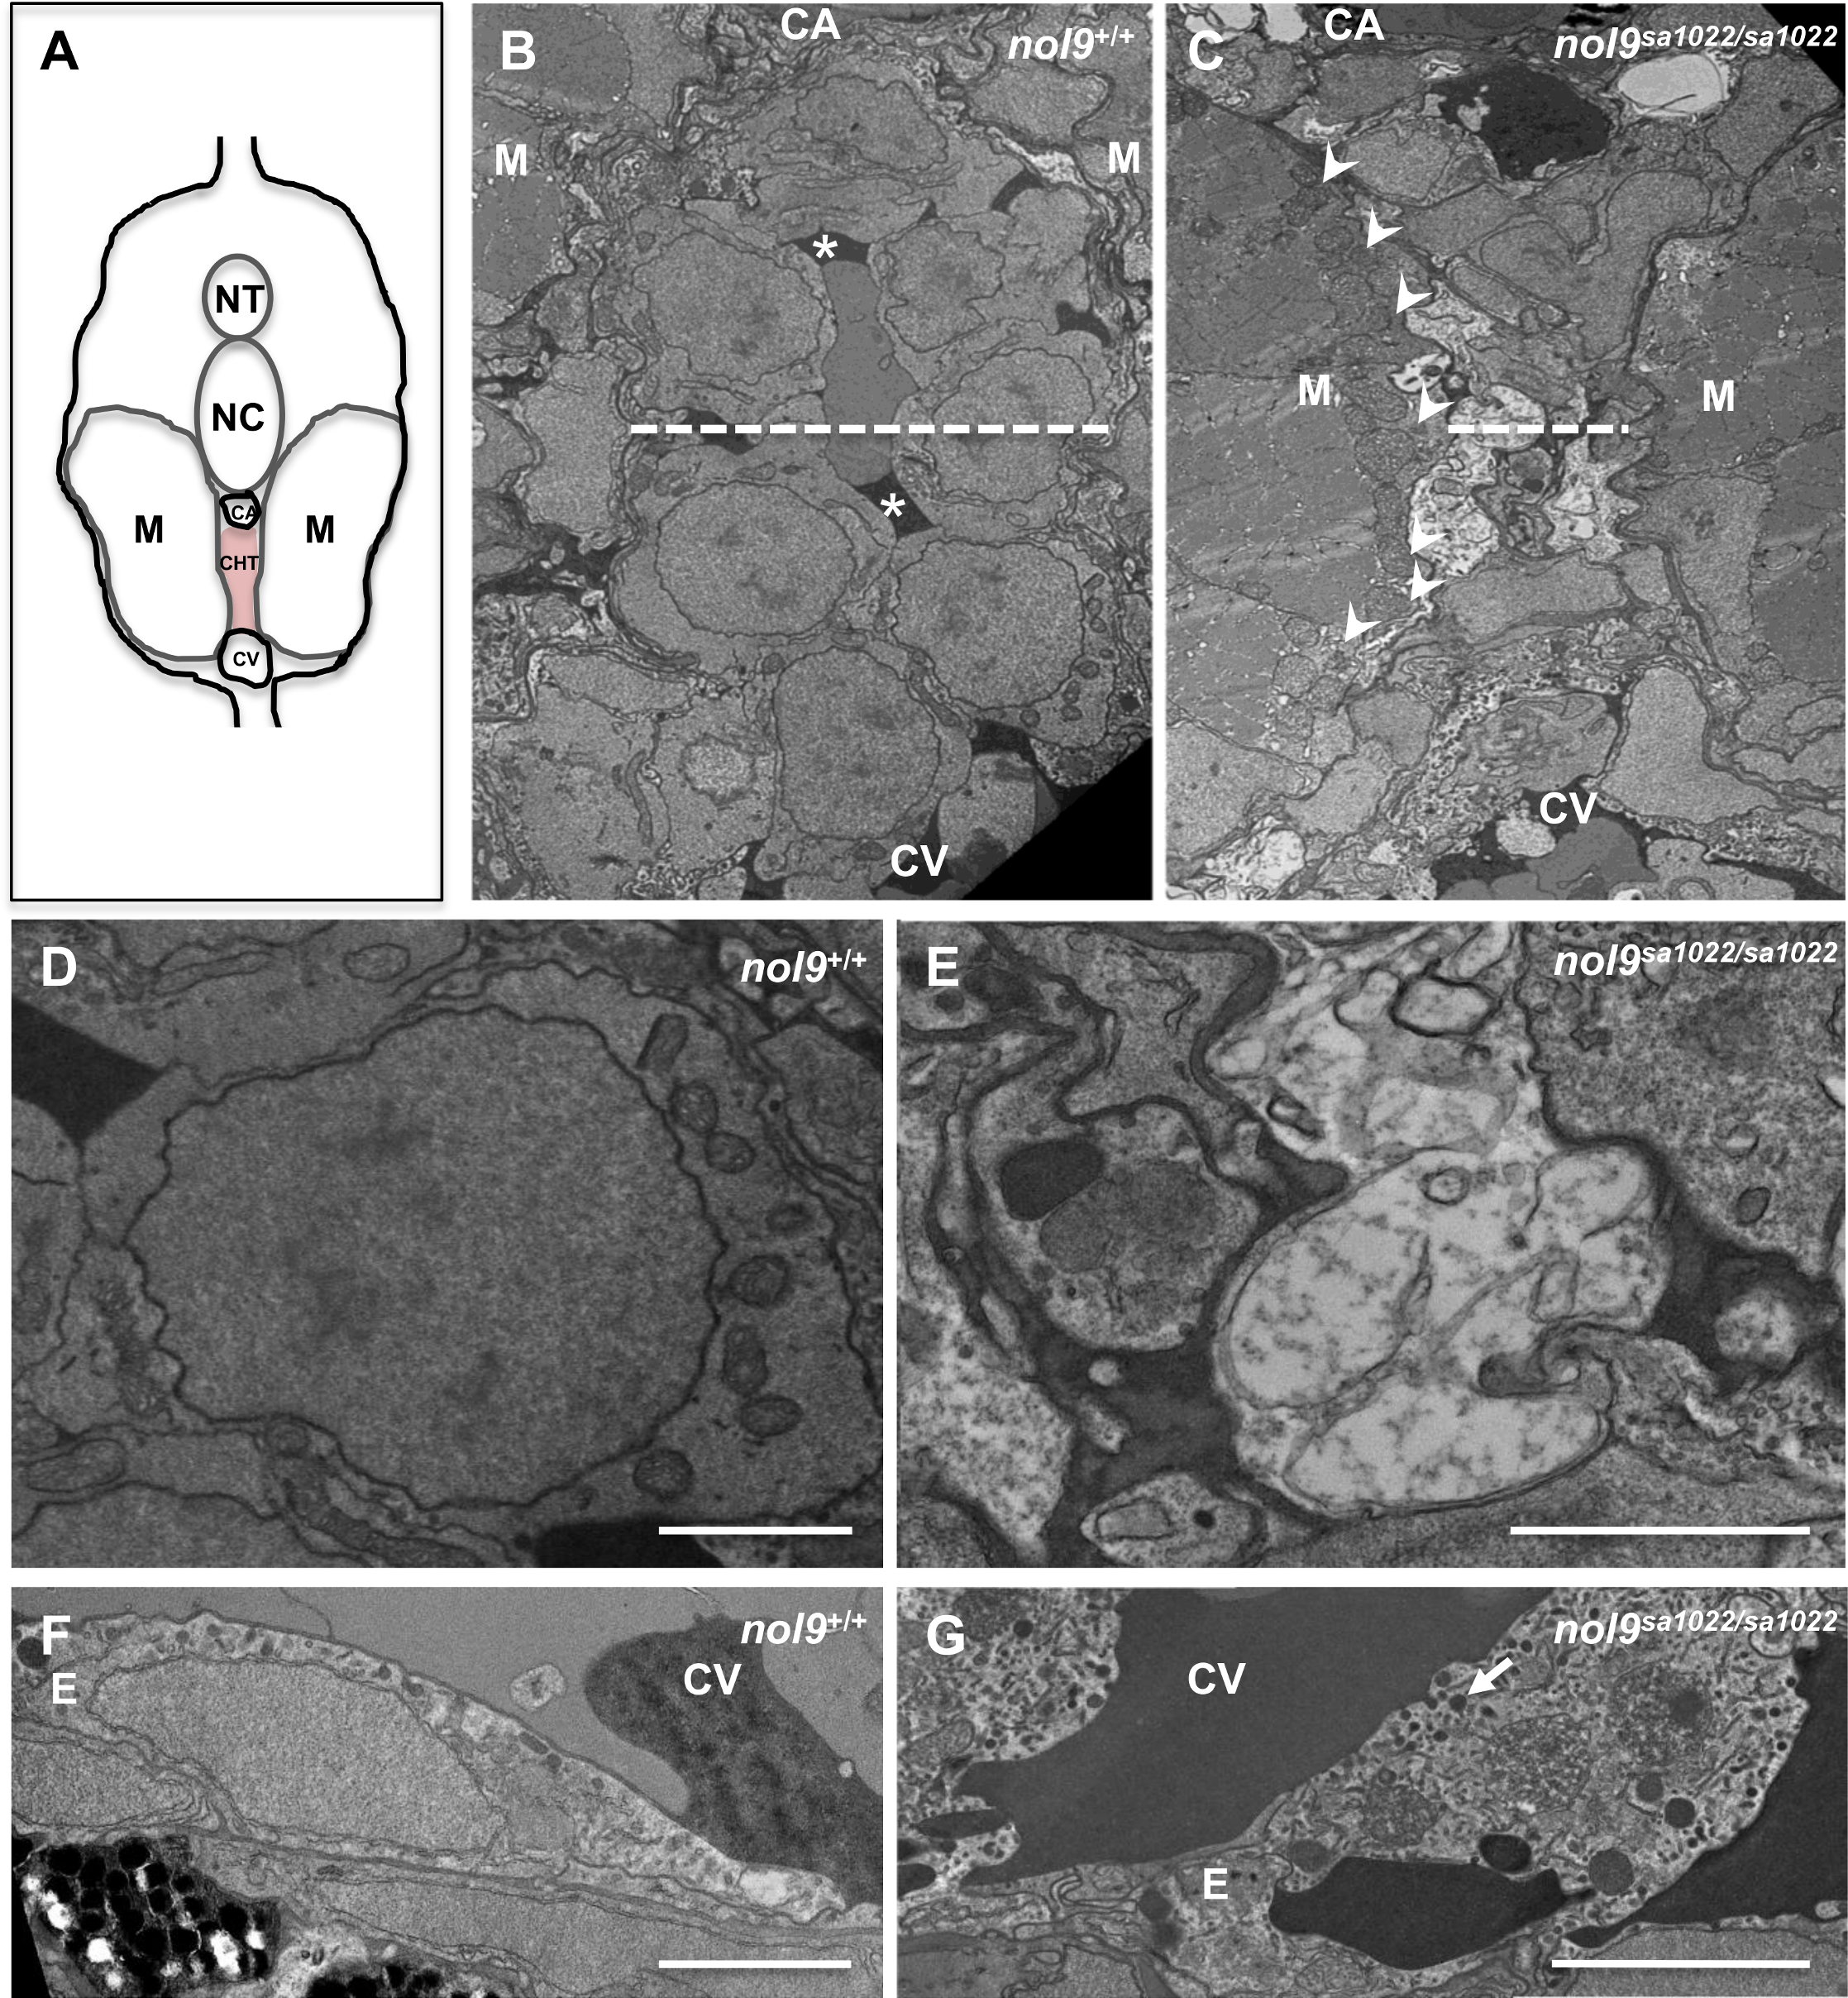
Ultrastructural studies of caudal hematopoietic tissue (CHT) in nol9sa1022/sa1022 larvae.
(A) Schematic representation of a transversal section in the CHT region of a 120 hpf zebrafish, dorsal up. NT–neural tube, NC–notochord, M—myotome, CA–caudal artery, CHT–caudal hematopoietic tissue, CV–caudal vein. (B-C) A low-magnification TEM image of the CHT from a nol9+/+ (B, n = 2) and nol9sa1022/sa1022 (C, n = 2) larvae. Dashed line denotes the width of the CHT. Arrowheads denote mitochondrial profiles visible within myotomes (M). Asterisks denote extracellular matrix (ECM). (D-E) High magnification TEM image of cells present in the CHT of nol9+/+ (D) and nol9sa1022/sa1022 (E) larvae. (F-G) High magnification TEM image of endothelial cells in the caudal vein of nol9+/+ (F) and nol9sa1022/sa1022 (G) larvae. Arrow denotes vesicles visible in the cytoplasm of the endothelial cell, reminiscent of lipofuscin. E–endothelium. Scale bars: 2 μm.