
|
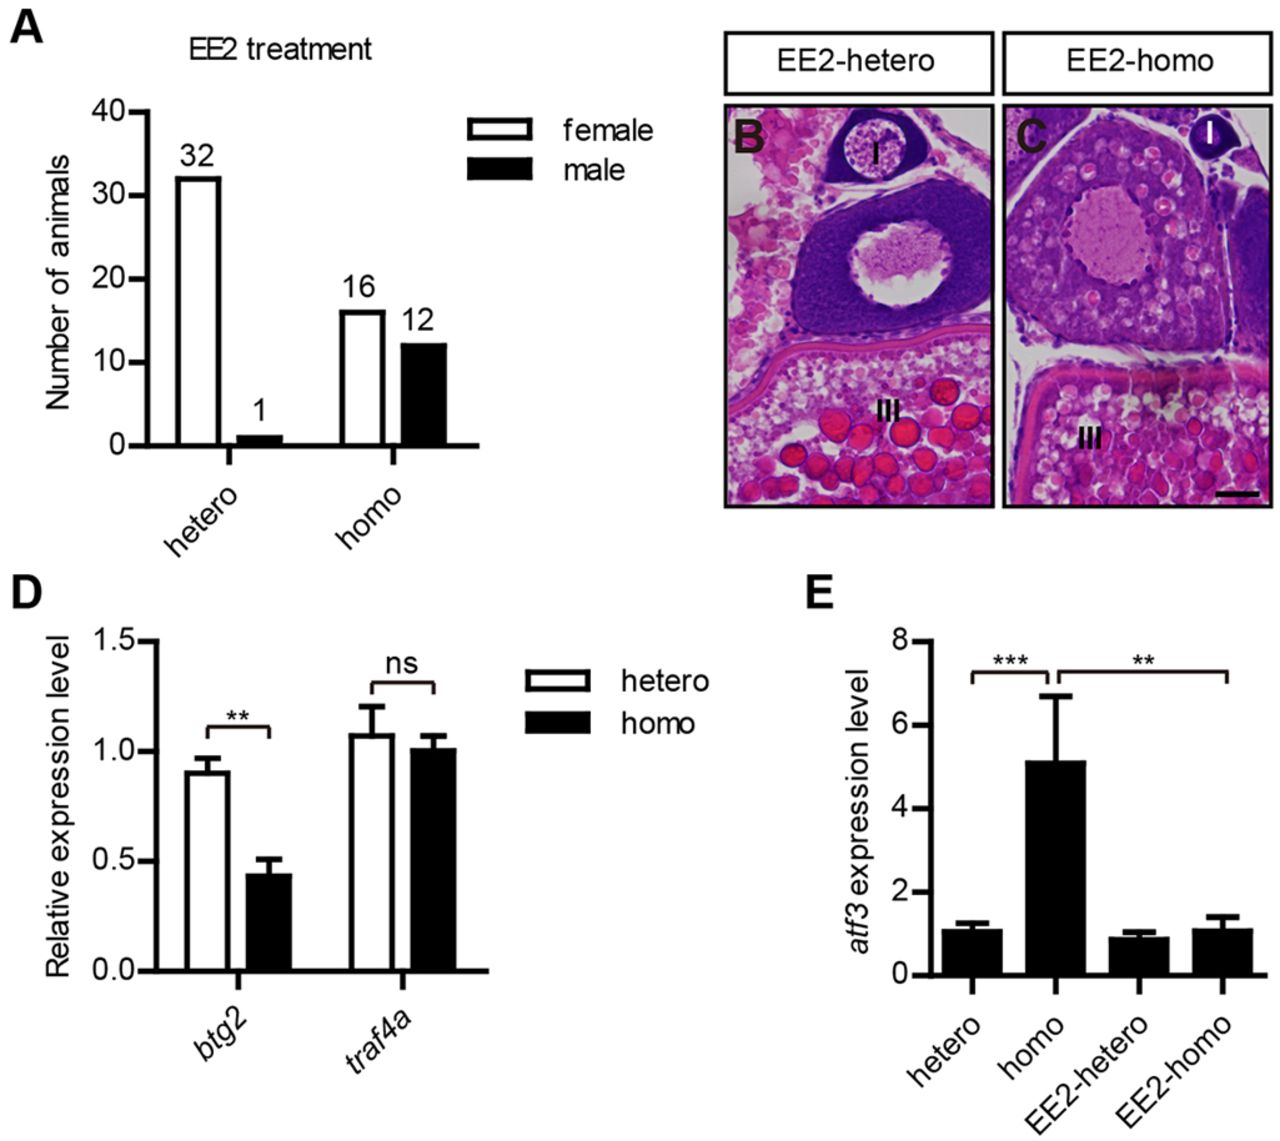
Fig. 5
EE2 treatment restores ovarian development in zar1 homozygous mutant. (A) Statistics for sex ratio of zar1 homozygous and heterozygous mutants after EE2 treatment. (B,C) H&E staining of ovarian tissue in EE2-treated zar1 homozygotes and heterozygotes. Similar to zar1 heterozygous ovaries, the treated homozygous mutant ovaries possess oocytes at all stages. (D) btg2 and traf4a expression analyzed by qPCR in zar1 homozygotes (n=6) and heterozygotes (n=6). (E) atf3 expression analyzed by qPCR in zar1 homozygotes (n=7) and heterozygotes (n=8) with or without EE2 treatment. Gene expression was normalized to expression of elongation factor 1 alpha (ef1a). hetero, zar1 heterozygotes; homo, zar1 homozygotes; EE2-hetero, EE2-treated zar1 heterozygotes (n=6); EE2-homo, EE2 treated zar1 homozygotes (n=6). Data are mean±s.e.m. **P<0.01, ***P<0.001; ns, not significant. Scale bar: 20 μm.