
IMAGE
Fig. S1
- ID
- ZDB-IMAGE-170201-29
- Publication
- Eisenhoffer et al., 2017 - A toolbox to study epidermal cell types in zebrafish
- All Figures
- Figures for Eisenhoffer et al., 2017
Image
|
Figure Caption
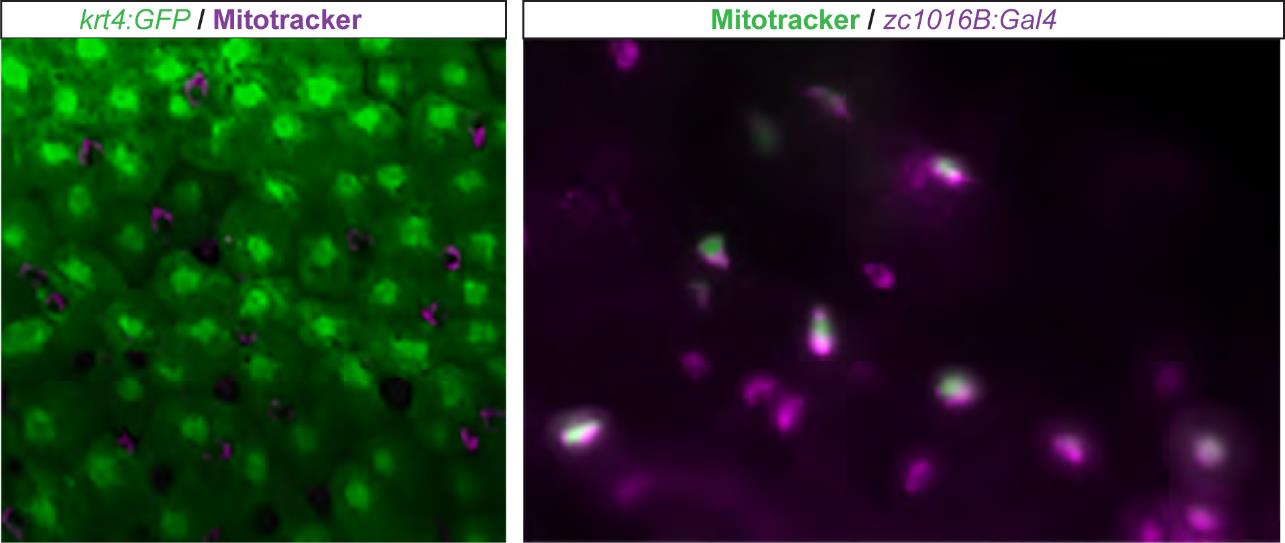
Fig. S1
Mitotracker staining reveals enhancer trap line expressed in ionocyte population. Mitotracker staining (magenta) in Tg(krt4:GFP) (green) zebrafish. Co-expression of mitotracker (green) in the zc1016B enhancer trap line (magenta).
Acknowledgments
This image is the copyrighted work of the attributed author or publisher, and
ZFIN has permission only to display this image to its users.
Additional permissions should be obtained from the applicable author or publisher of the image.
Full text @ J. Cell Sci.