
IMAGE
Fig. 2
- ID
- ZDB-IMAGE-170201-24
- Publication
- Eisenhoffer et al., 2017 - A toolbox to study epidermal cell types in zebrafish
- All Figures
- Figures for Eisenhoffer et al., 2017
Image
|
Figure Caption
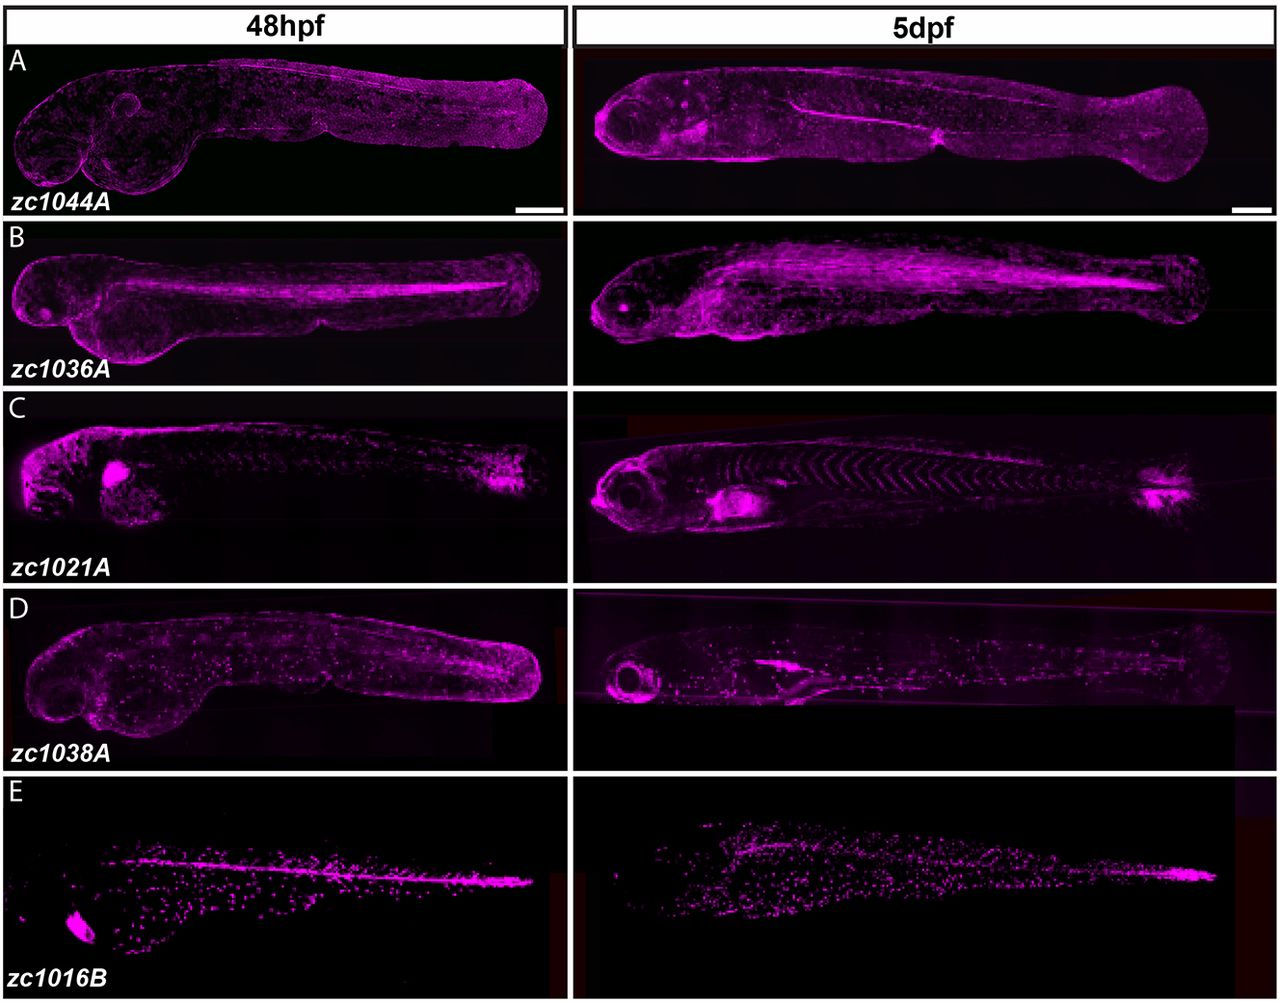
Fig. 2
Identification of Gal4 enhancer trap lines expressed in distinct cell types of the developing epidermis. (A-E) Composite images from multiple maximum intensity projections of Gal4 enhancer trap lines driving Tg(UAS-E1b:nfsB-mCherry) (shown in magenta) in 48-hour- and 5-day-old larvae. Scale bars: 250 μm.
Acknowledgments
This image is the copyrighted work of the attributed author or publisher, and
ZFIN has permission only to display this image to its users.
Additional permissions should be obtained from the applicable author or publisher of the image.
Full text @ J. Cell Sci.