
Fig. 3
- ID
- ZDB-IMAGE-170131-2
- Publication
- Zhou et al., 2016 - PEG-b-PCL polymeric nano-micelle inhibits vascular angiogenesis by activating p53-dependent apoptosis in zebrafish.
- All Figures
- Figures for Zhou et al., 2016
|
Fig. 3
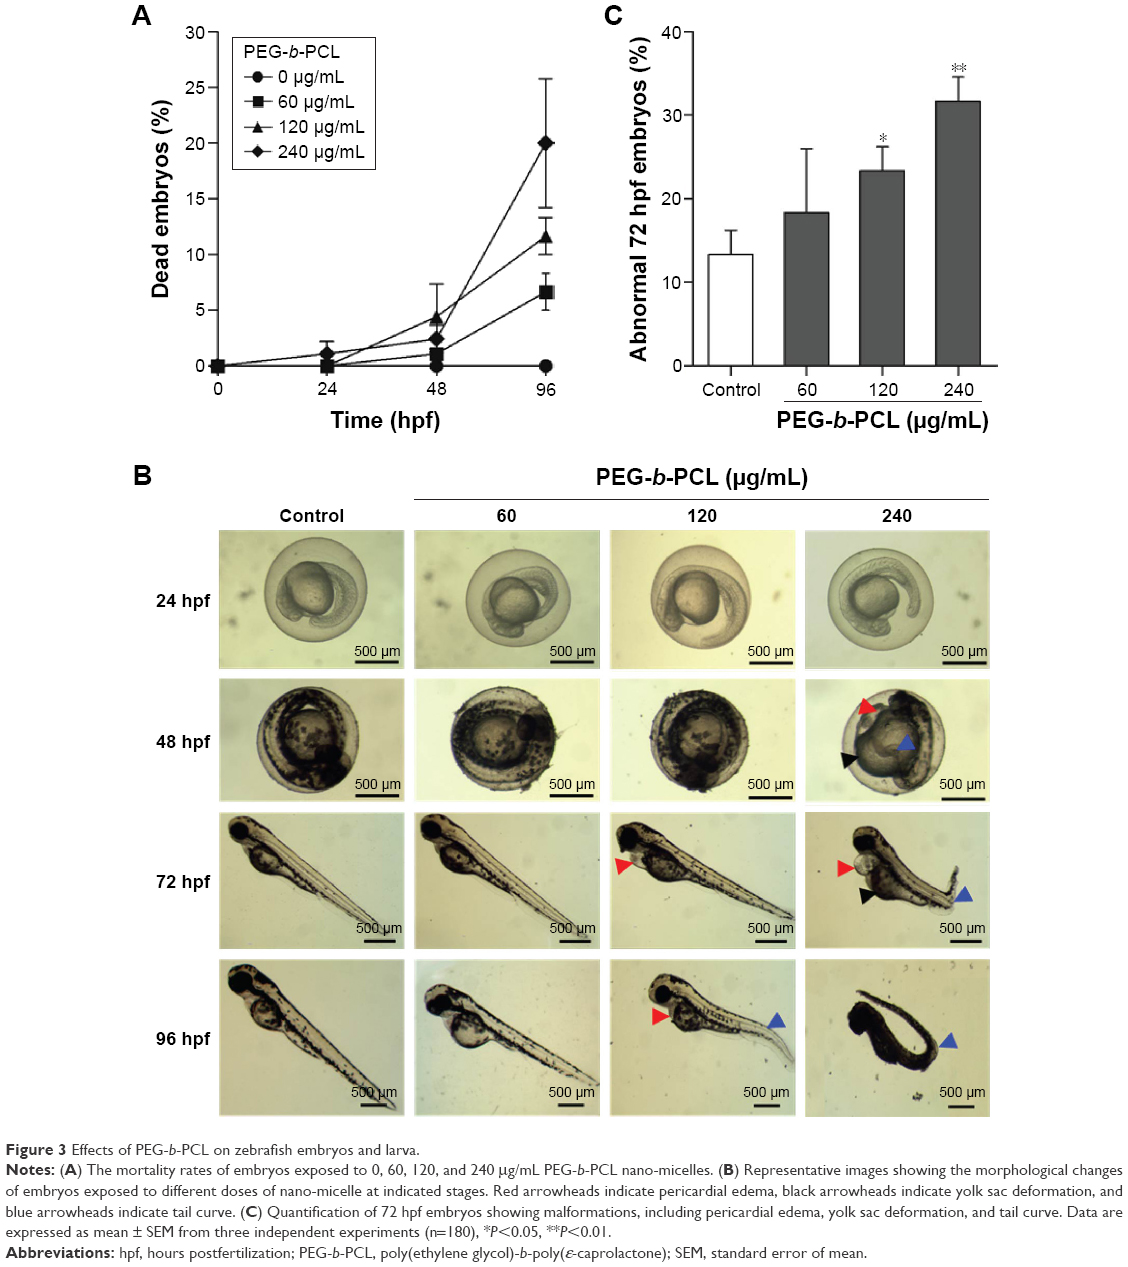
Figure 3 Effects of PEG-b-PCL on zebrafish embryos and larva.
Notes: (A) The mortality rates of embryos exposed to 0, 60, 120, and 240 μg/mL PEG-b-PCL nano-micelles. (B) Representative images showing the morphological changes of embryos exposed to different doses of nano-micelle at indicated stages. Red arrowheads indicate pericardial edema, black arrowheads indicate yolk sac deformation, and blue arrowheads indicate tail curve. (C) Quantification of 72 hpf embryos showing malformations, including pericardial edema, yolk sac deformation, and tail curve. Data are expressed as mean ± SEM from three independent experiments (n=180), *P<0.05, **P<0.01.
Abbreviations: hpf, hours postfertilization; PEG-b-PCL, poly(ethylene glycol)-b-poly(ε-caprolactone); SEM, standard error of mean.