
Fig. 5
- ID
- ZDB-IMAGE-161230-9
- Genes
- Publication
- Han et al., 2016 - Identification of novel genes and networks governing hematopoietic stem cell development
- All Figures
- Figures for Han et al., 2016
|
Fig. 5
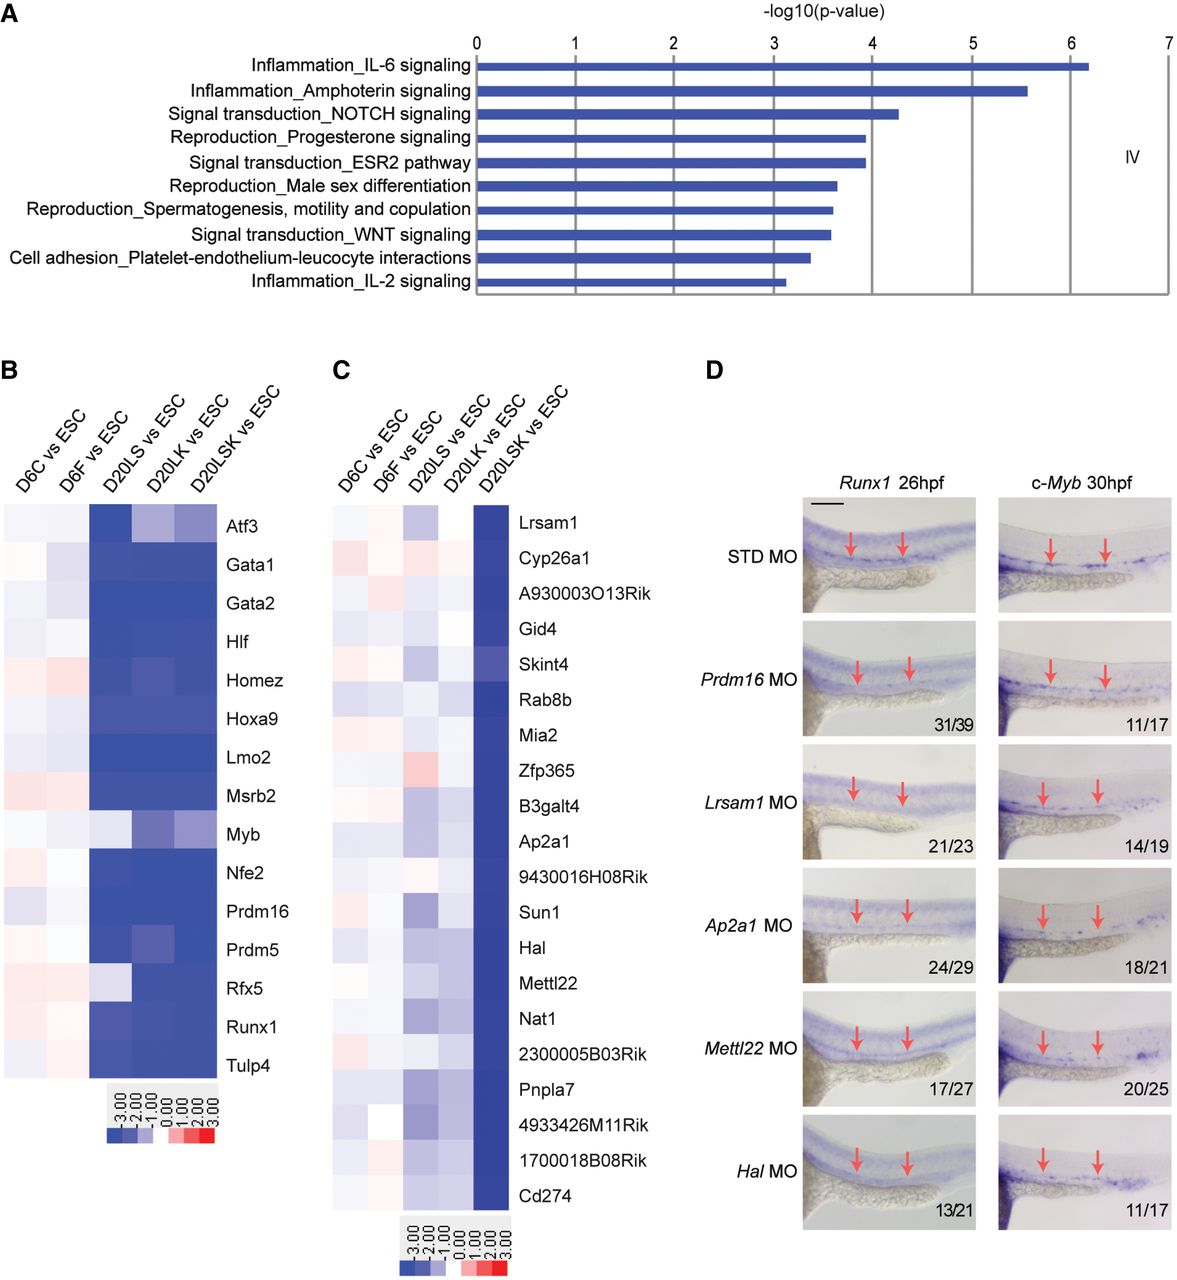
Identification of genes required for HSPC specification and validation in zebrafish
A. GO analysis of biological processes among Group IV target genes, showing enrichment of networks in the endothelial–hematopoietic transition.
B. Heat map showing bona fide HSC regulators in Group IV target genes.
C. Heat map showing the most depleted shRNAs in pairwise comparisons between the D20LSK and D20LK populations.
D. Validation of the involvement of Group X target genes Lrsam1, Ap2a1, Mettl22, and Hal in zebrafish hematopoiesis by MO‐mediated knockdown. Whole‐mount in situ hybridization of Runx1 and c‐Myb expression is shown at 26 hpf and 30 hpf, respectively. Prdm16 knockdown serves as a positive control. Note that nonspecific staining for Runx1 and c‐Myb was largely unaffected by targeted MO knockdown, whereas HSC markers Runx1 and c‐Myb staining were notably reduced in discrete cells in the ventral region of the dorsal aorta (arrows). Scale bar = 100 μm.