
IMAGE
Fig. S1
- ID
- ZDB-IMAGE-161227-5
- Publication
- Frisca et al., 2016 - Role of ectonucleotide pyrophosphatase/phosphodiesterase 2 in the midline axis formation of zebrafish
- All Figures
- Figures for Frisca et al., 2016
Image
|
Figure Caption
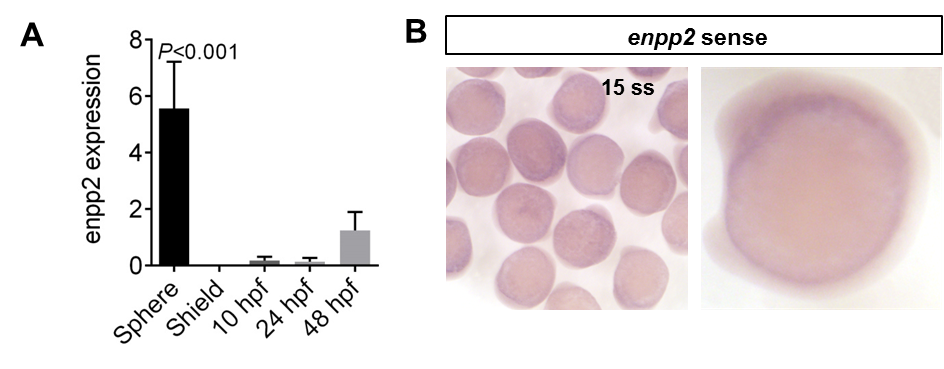
Fig. S1
A. enpp2 overexpression measured by RT-PCR in the early embryogenesis of zebrafish. Developmental series of RT-PCR at designated stages were performed using enpp2 Taqman® probe. Data are mean ± SEM. Statistical analysis was established by one-way ANOVA; * P < 0.05; ** P < 0.01. B. In situ hybridisation of enpp2 at 15 somite stage embryos (ss) using sense probe showing no specific signal in comparison to embryo hybridised with antisense probe (see Figure 1 A).
Acknowledgments
This image is the copyrighted work of the attributed author or publisher, and
ZFIN has permission only to display this image to its users.
Additional permissions should be obtained from the applicable author or publisher of the image.
Full text @ Sci. Rep.