
Fig. 6
- ID
- ZDB-IMAGE-161227-16
- Publication
- Kawashima et al., 2016 - The Serotonergic System Tracks the Outcomes of Actions to Mediate Short-Term Motor Learning
- All Figures
- Figures for Kawashima et al., 2016
|
Fig. 6
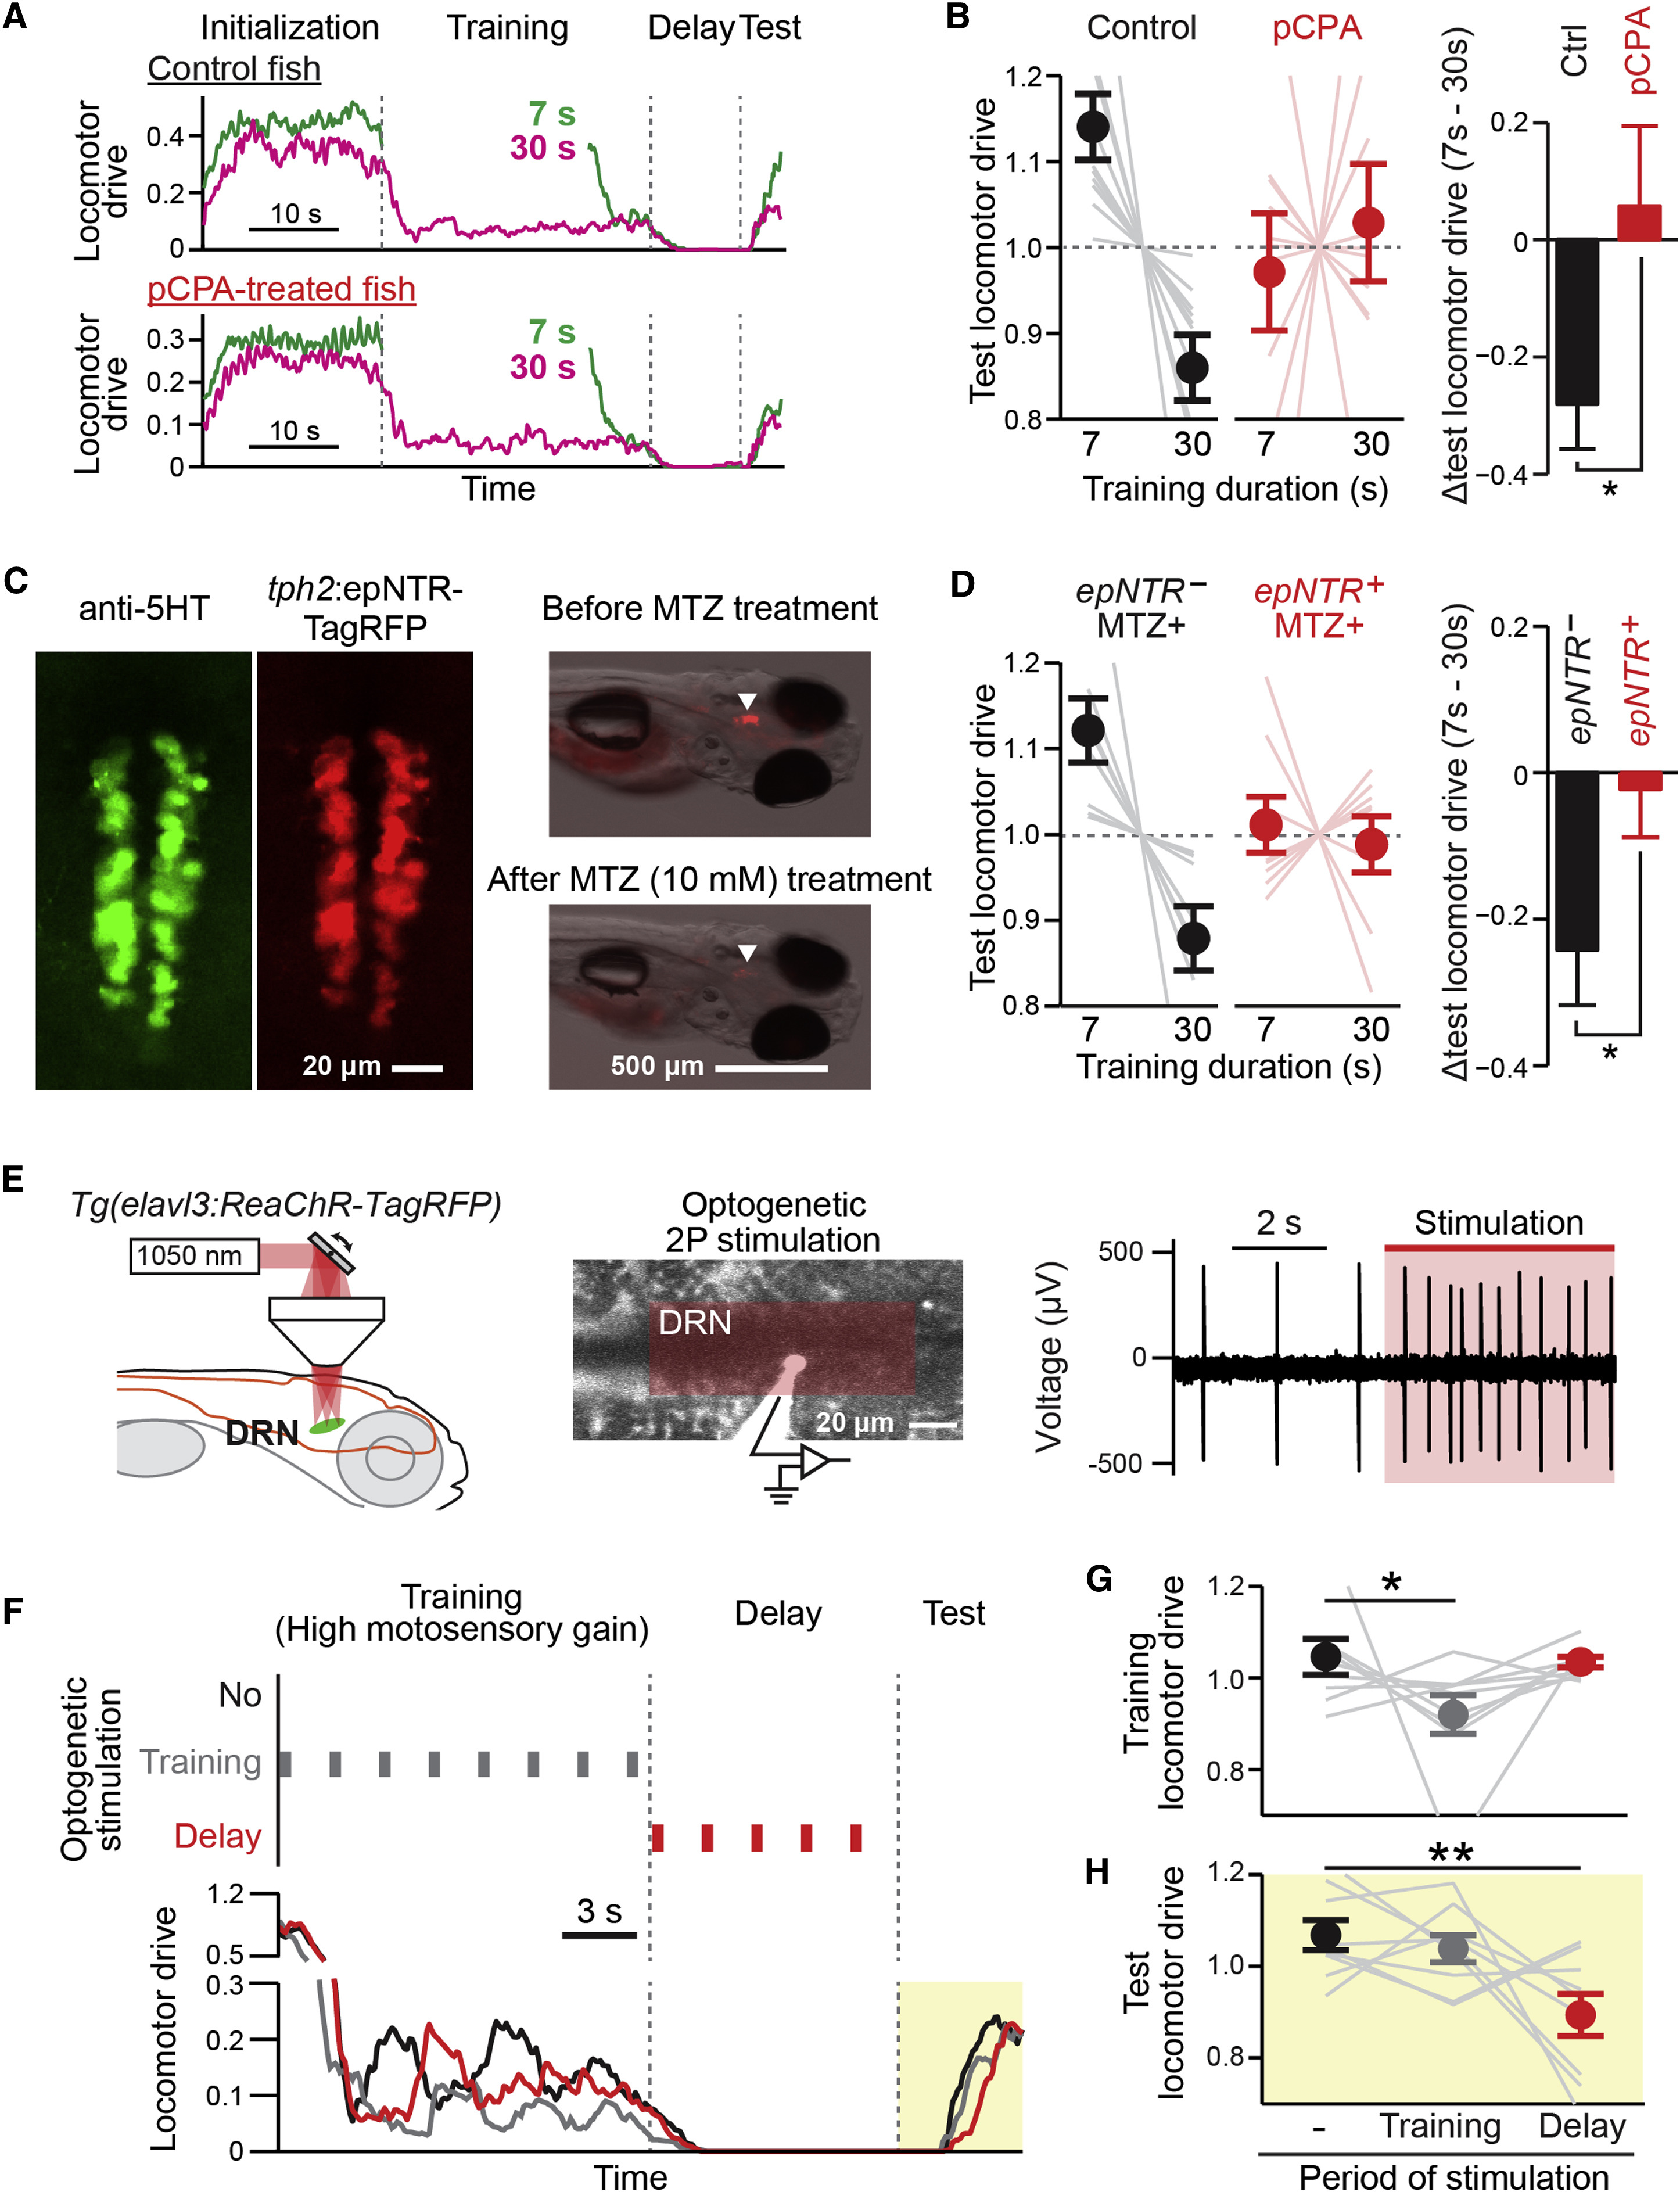
Serotonin Transmission and the DRN Are Causally Related to Learning
(A and B) Effects of pCPA serotonin release block on the learning effect. (A) Behavioral trace of control (top) and pCPA-treated (bottom) fish during the motor learning paradigm. (B) pCPA treatment leads to a loss of the learning effect. Left: test locomotor drive (integrated locomotor drive in the test period, normalized by the average across training conditions) is attenuated by longer training in the control group (black), but not in the pCPA-treated group (red). Faint lines, data from individual fish. Right: differences between test locomotor drive after short (7 s) or long (30) training durations. ∗p = 0.017 by Wilcoxon rank-sum test between ten control fish and ten pCPA-treated fish. Error bars, SEM across fish.
(C and D) Effect of chemical-genetic ablation of tph2+ serotonergic neurons on motor learning. (C) Left: 5-HT immunostaining (green) and nitroreductase (epNTR) expression in a Tg(tph2:epNTR-RFP) fish (red) in the DRN. Right: epNTR-TagRFP expression in the DRN (arrowhead) taken before (top, 4 dpf) and after (bottom, 6 dpf) metronidazole (MTZ) treatment for the same fish, fluorescence overlaid on bright field images. Most DRN neurons disappear. (D) Chemical genetic ablation leads to loss of the learning effect. Left: locomotor drive in the test period is attenuated by longer training in epNTR− siblings (black), but not in epNTR+ group (red) after MTZ treatment. Faint lines, data from individual fish. Right: differences between test locomotor drive after short (7 s) and long (30 s) training. ∗p = 0.046 by Wilcoxon rank-sum test between eight epNTR− fish and nine epNTR+ fish. Error bars, SEM across fish.
(E) Two-photon optogenetic activation of DRN neurons. Left: DRN neurons are specifically activated by laser scanning over a plane within the DRN. Center: location of a DRN neuron recorded by loose patch and electroporated with dye after recording. Red box, scan area. Right: raw recorded trace before and during optogenetic activation (red shadow) showing that the laser elicits extra spikes.
(F) Instantaneous effects of DRN activity on locomotor drive tested by stimulation during training (gray vertical lines and behavioral trace). Lasting effects were tested by stimulating in the delay period (red).
(G) DRN stimulation suppresses ongoing locomotor drive. Training locomotor drive is the integrated drive in the training period, normalized to the average across three stimulation conditions. p = 0.027 by one-way ANOVA. ∗p = 0.038 by Tukey’s post hoc test. Error bars, SEM, nine fish. Gray dotted lines, data from individual fish.
(H) DRN stimulation in the delay period attenuates drive in the subsequent test period. This effect bridges the gap of ∼3 s between the last stimulation pulse and the first swim bout in the test period. p = 0.0055 by one-way ANOVA. ∗∗p = 0.0069 by Tukey’s post hoc test between delay stimulation and no stimulation for same nine fish as (G). Error bars, SEM across fish. Gray dotted lines, data from individual fish.
See also Figures S6 and S7.
Reprinted from Cell, 167, Kawashima, T., Zwart, M.F., Yang, C.T., Mensh, B.D., Ahrens, M.B., The Serotonergic System Tracks the Outcomes of Actions to Mediate Short-Term Motor Learning, 933-946.e20, Copyright (2016) with permission from Elsevier. Full text @ Cell