
Fig. S3
- ID
- ZDB-IMAGE-161227-12
- Publication
- Kawashima et al., 2016 - The Serotonergic System Tracks the Outcomes of Actions to Mediate Short-Term Motor Learning
- All Figures
- Figures for Kawashima et al., 2016
|
Fig. S3
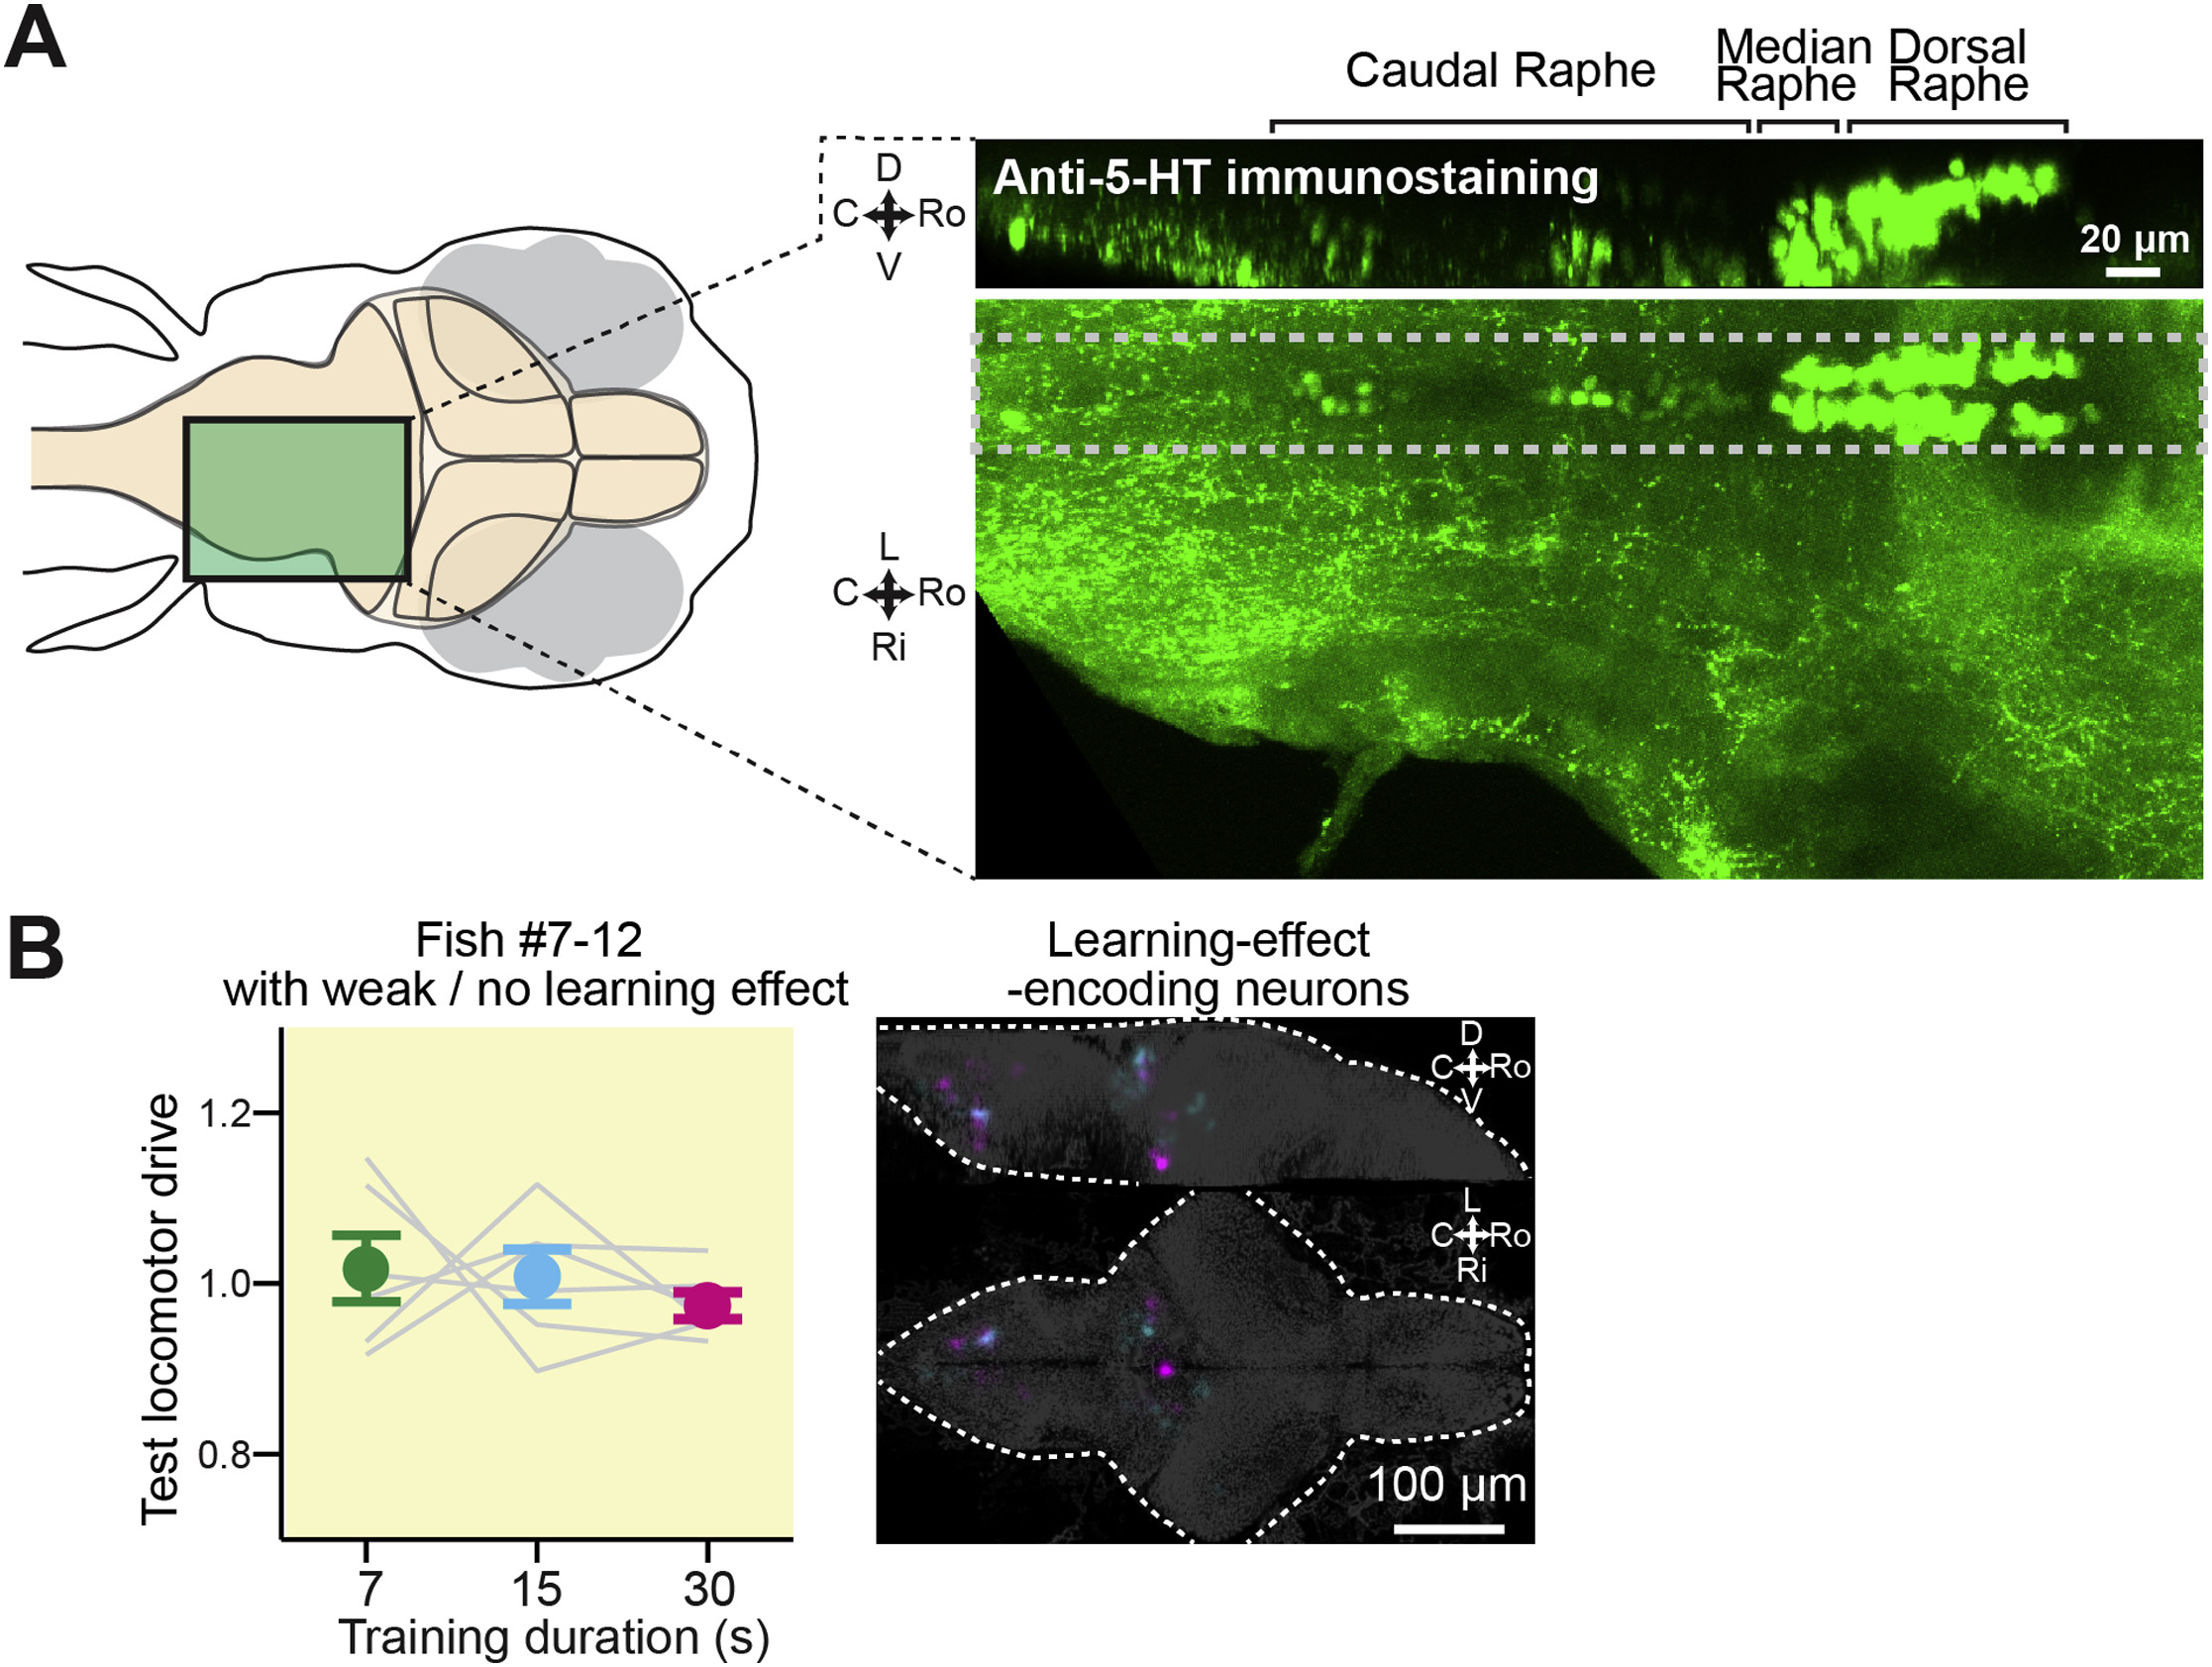
Anatomy of Serotonergic Neurons in the DRN, Related to Figure 1
(A) Distribution of 5-HT positive neurons in the hindbrain. Left, schematic diagram of hindbrain region imaged with a confocal microscope. Right, maximum intensity projection of 5-HT immunostaining from the side (top) and the top (bottom) of the hindbrain. The side view is a maximum intensity projection of the tissue between the dashed gray lines in the top projection. Serotonergic clusters were classified and labeled above the top panel according to previous literature ( Lillesaar et al., 2009 and Parker et al., 2013). D, dorsal; V, ventral; Ro, rostral; C, caudal; Ri, right; L, left.
(B) Left, effect of training duration on behavior in the test period, as described in Figures 1D–1F, in the fish group with weak/no learning effect. Error bars: SEM across fish. Gray lines represent data from individual fish. Right, the overlaid map of learning-effect-encoding neurons in a fish group with weak/no learning effect at the behavioral level, showing far fewer neurons (53 ± 6 and 68 ± 11 neurons per fish for cyan and magenta neurons, respectively) that reach criterion compared to fish with strong learning effect in Figure 1H (206 ± 26 and 220 ± 33 neurons per fish for cyan and magenta neurons, respectively). Neurons are extracted by the same parameters (1) and (2) as explained in the main text and Figures 1G and 1H. D, dorsal; V, ventral; Ro, rostral; C, caudal; Ri, right; L, left.
Reprinted from Cell, 167, Kawashima, T., Zwart, M.F., Yang, C.T., Mensh, B.D., Ahrens, M.B., The Serotonergic System Tracks the Outcomes of Actions to Mediate Short-Term Motor Learning, 933-946.e20, Copyright (2016) with permission from Elsevier. Full text @ Cell