
Fig. 1
- ID
- ZDB-IMAGE-161227-11
- Publication
- Kawashima et al., 2016 - The Serotonergic System Tracks the Outcomes of Actions to Mediate Short-Term Motor Learning
- All Figures
- Figures for Kawashima et al., 2016
|
Fig. 1
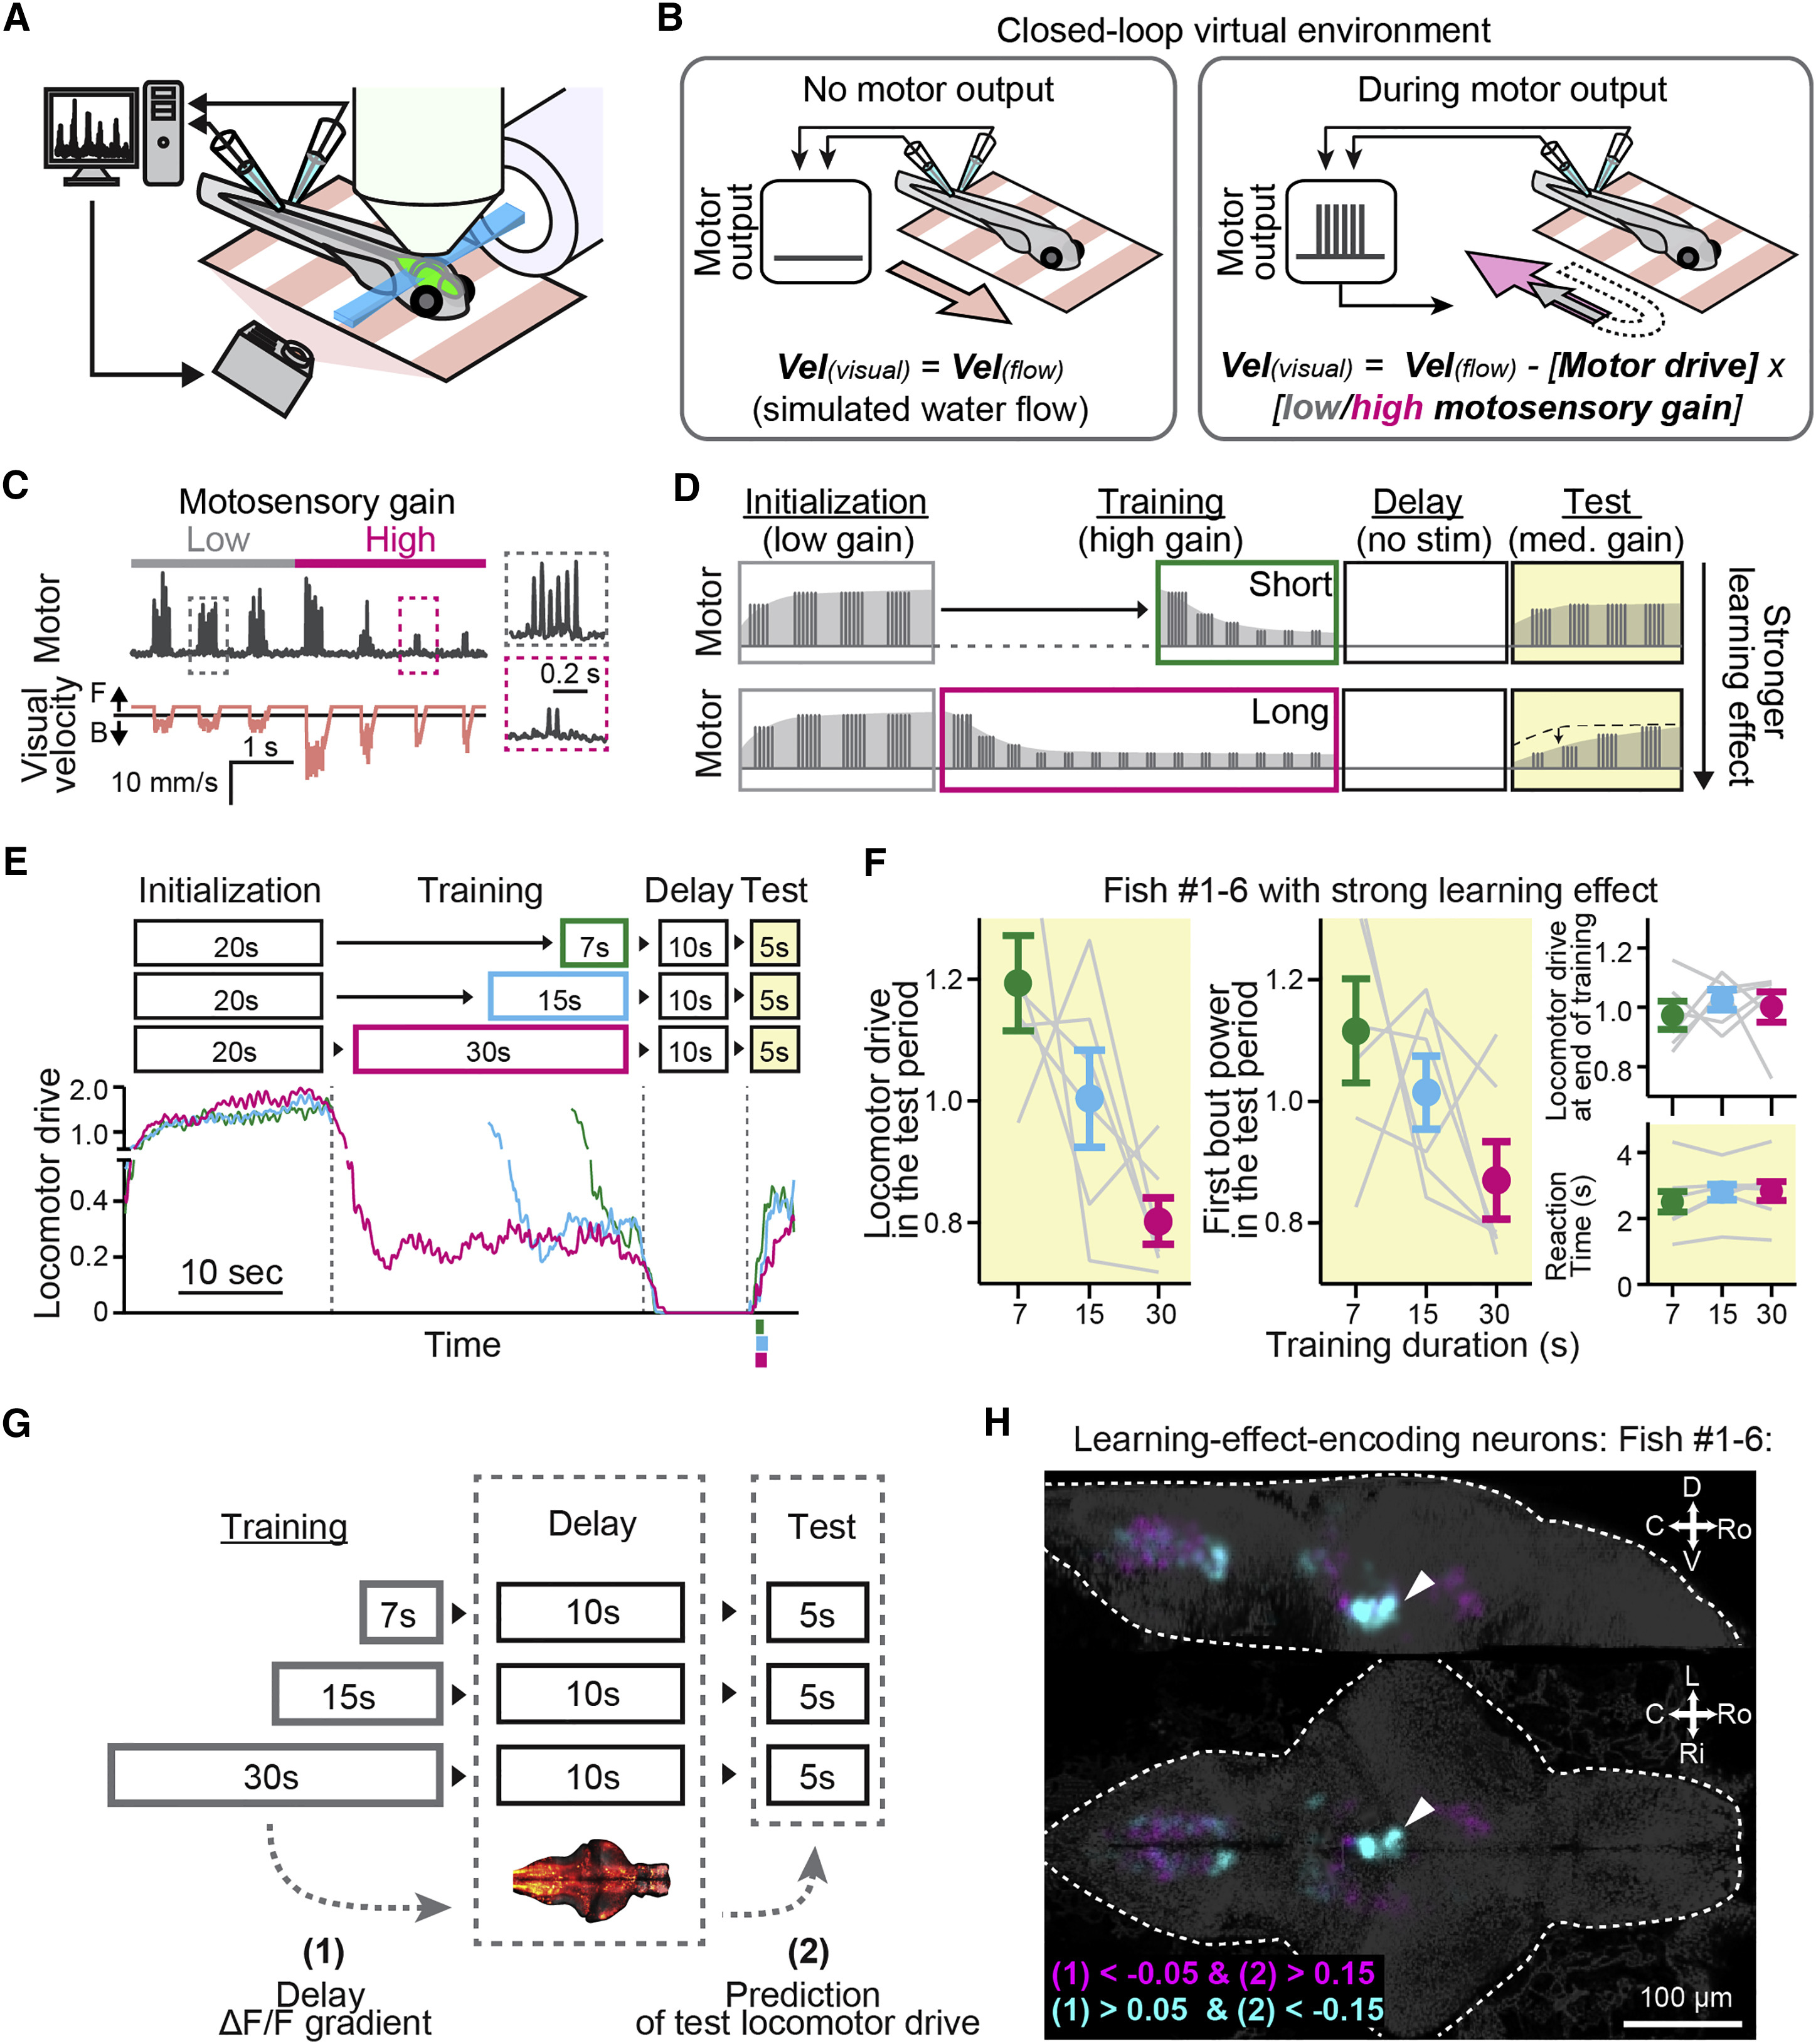
Whole-Brain Activity Mapping of Learning-Effect-Encoding Neurons
(A) Experimental setup. Signals from motor neuron axons (fictive swimming) trigger real-time visual feedback. A light-sheet microscope images the brain.
(B) Virtual environment. When the fish does not fictively swim (left), a visual scene moves forward slowly to elicit swimming. Fictive swim signals (right, inset) move the visual scene backward to mimic the effect of forward swimming. The speed of visual feedback is controlled by the motosensory gain. For the same swim bout, high gain yields more visual flow (magenta arrow) than low gain (gray arrow).
(C) Example swim trace and visual motion during a transition from low to high motosensory gain. “Motor” signal is the power in a sliding window of the tail voltage signal. Insets show zoom-ins of boxed regions.
(D) The short-term motor learning paradigm consists of repetitions of the initialization, training, delay, and test periods. No time passes during arrows between periods. Schematized electrophysiology traces represent the strength of fictive swim bouts. The learning effect is the dependence of locomotor drive in the test period on the duration of training.
(E) Representative fish behavior. Longer high-motosensory-gain training (magenta) more strongly attenuates locomotor drive in the test period. Colored lines below the x axis of the test period, mean ± SD of reaction times.
(F) Behavior across six fish with strong learning effect. Left: locomotor drive in the test period (average integrated swim power in the test period normalized by the average across three training conditions) is more attenuated after longer training. Right: locomotor drive at the end of training (top, last 5 s, normalized across conditions) and reaction time to the test stimulus (bottom) are similar across training durations. Gray lines, data from individual fish. Error bars, SEM across fish. Plots and statistics for all fish are in Figures S1B and S1C.
(G) Whole-brain analysis. Encoding of the learning effect was quantified by (1) dependence of a neuron’s average ΔF/F activity signal in the delay period on the preceding training duration, and (2) degree to which a neuron’s ΔF/F in the delay period predicts the locomotor drive in the subsequent test period (test locomotor drive) trial-by-trial.
(H) Functional brain map of neurons with parameters (1) and (2) exceeding thresholds, overlay from six fish with strong learning effect. A density of neurons occurs in the DRN (white arrow). Thresholds for extracting neurons are indicated at the bottom left (cyan for positive correlation to the learning effect; magenta for negative).
See also Figures S2 and S3 and Movie S1.
Reprinted from Cell, 167, Kawashima, T., Zwart, M.F., Yang, C.T., Mensh, B.D., Ahrens, M.B., The Serotonergic System Tracks the Outcomes of Actions to Mediate Short-Term Motor Learning, 933-946.e20, Copyright (2016) with permission from Elsevier. Full text @ Cell