
IMAGE
Fig. S2
- ID
- ZDB-IMAGE-161208-4
- Genes
- Publication
- Topczewska et al., 2016 - The Morphogenesis of Cranial Sutures in Zebrafish
- All Figures
- Figures for Topczewska et al., 2016
Image
|
Figure Caption
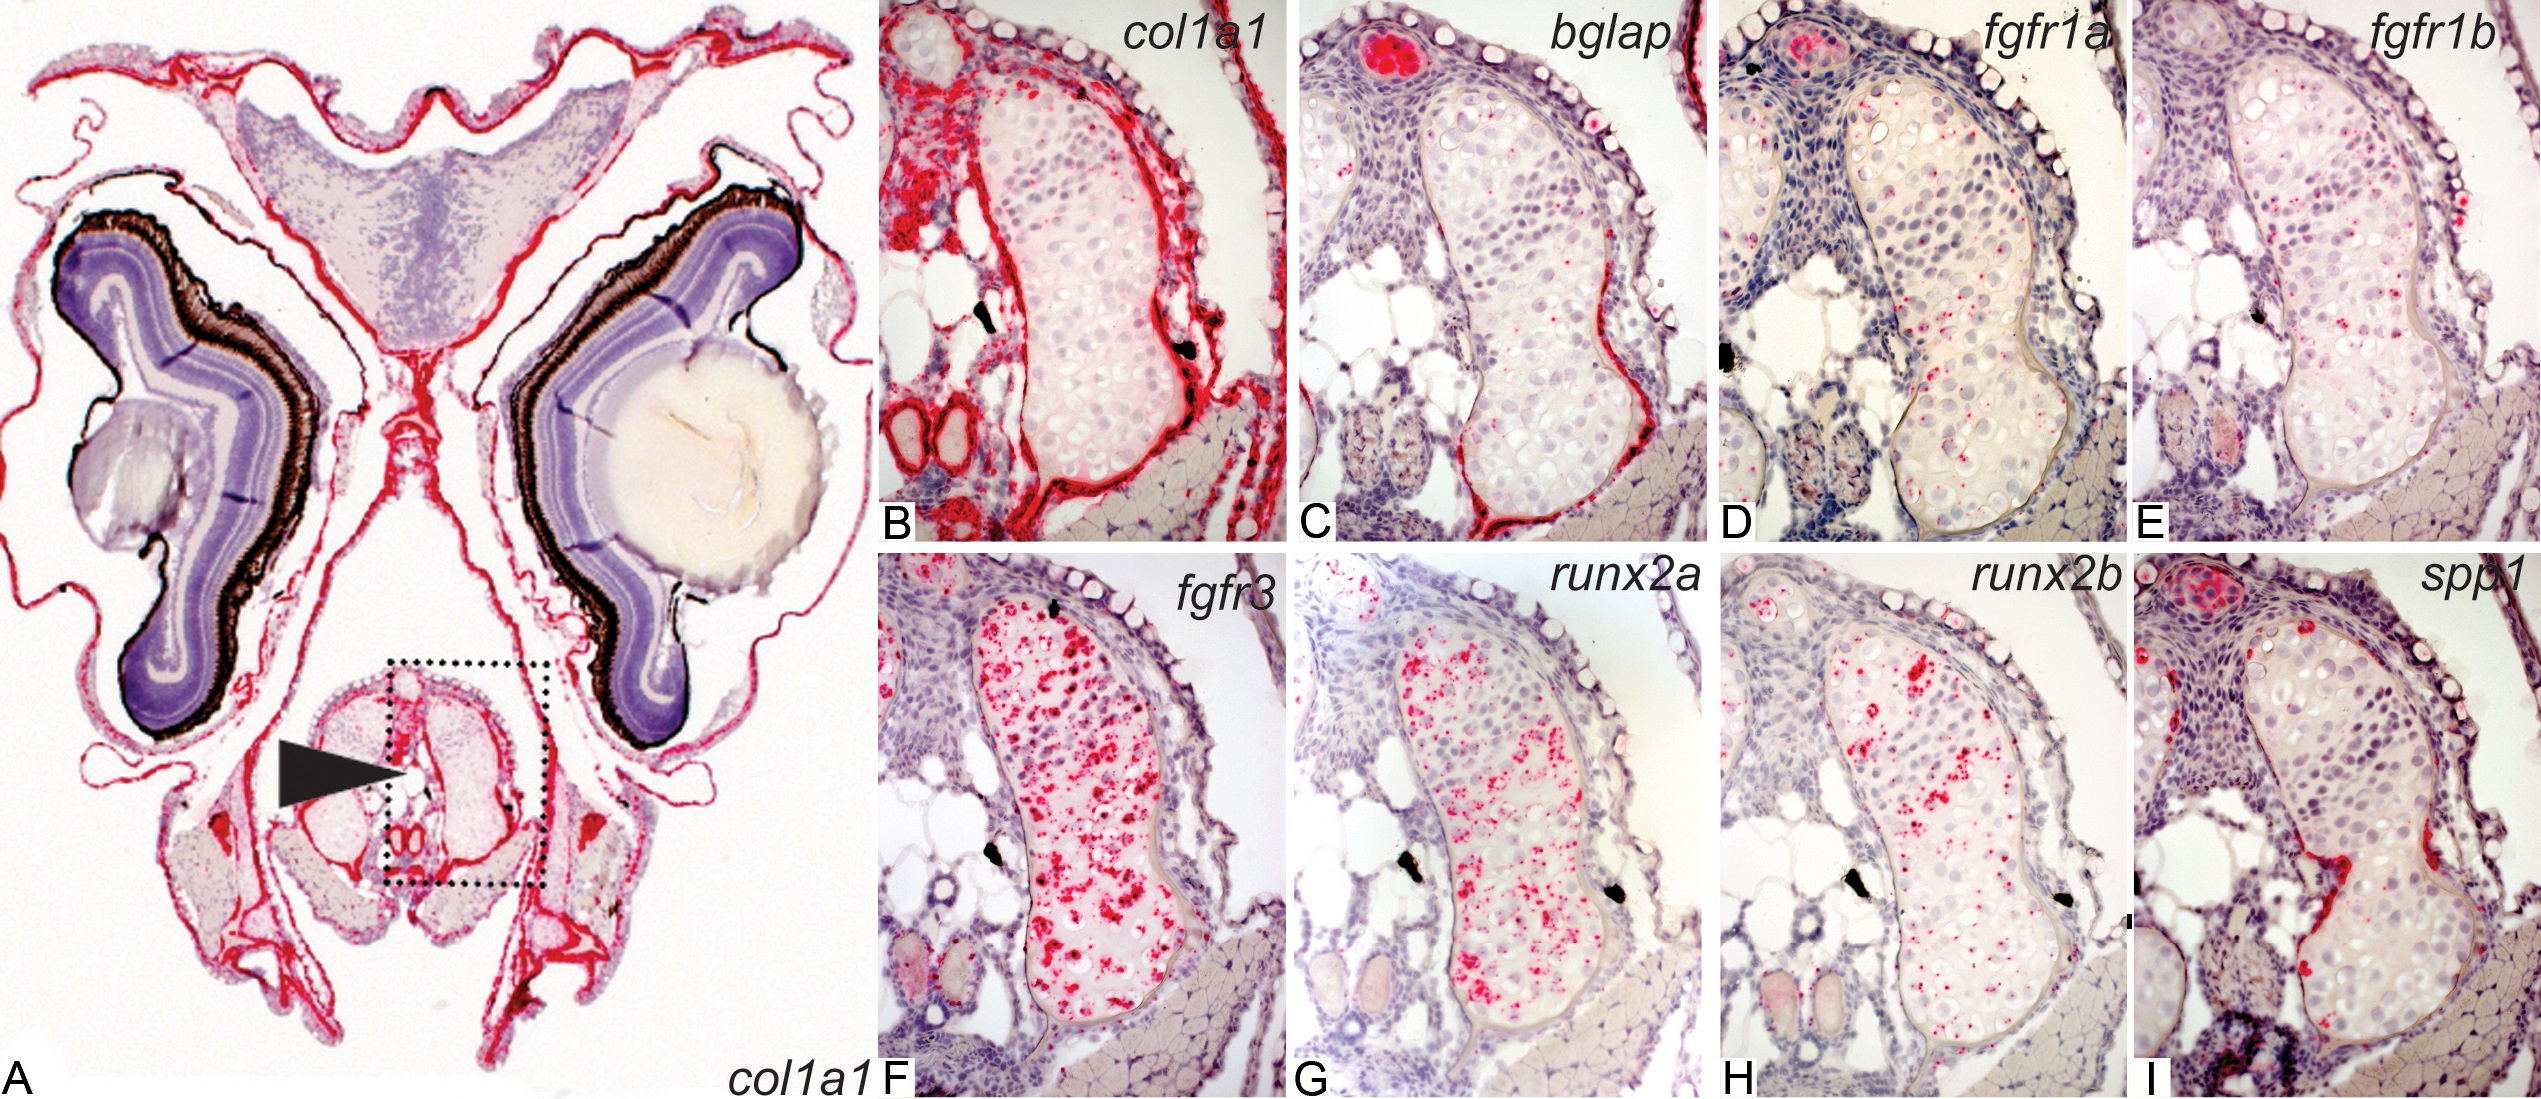
Fig. S2
The RNA in situ detection in ceratohyal cartilage at 6 wpf evaluated by RNAscope technique.
The images of the ceratohyal cartilage (dotted box and black arrowhead in A) collected from the tissue sections used for the interfrontal suture analysis shown in Fig 6 and S1 Fig. The expression of individual genes is visualized in red, counterstained with haematoxylin for nuclei in purple. The expression pattern of (A, B) col1a1a, (C) bglap, (D) fgfr1a, (E) fgfr1b, (F) fgfr3, (G) runx2a, (H) runx2b, (I) spp1.
Figure Data
Acknowledgments
This image is the copyrighted work of the attributed author or publisher, and
ZFIN has permission only to display this image to its users.
Additional permissions should be obtained from the applicable author or publisher of the image.
Full text @ PLoS One