
Image
|
Figure Caption
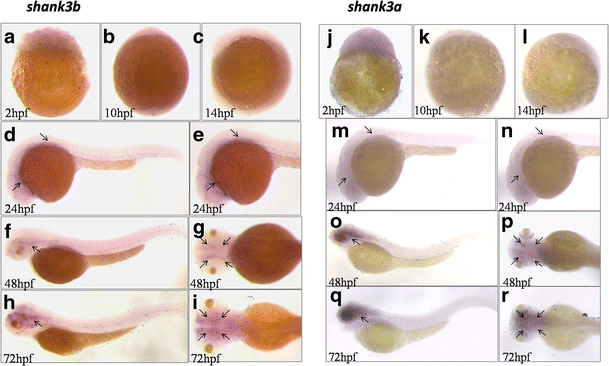
Fig. 3
Analysis of region-specific expression of shank3a and shank3b in wild-type zebrafish by WISH. a–i WISH analysis of the level and pattern of shank3a and shank3b expressions at 2, 10, 14, 24, 48, and 72 hpf were showed. The black arrow heads in d–i and m–r show the expression signals in the zebrafish larva brain. Obviously, the expression of both of these isoforms was mainly concentrated in the nervous system of zebrafish larvae, particularly in the anterior-ventral forebrain
Figure Data
Acknowledgments
This image is the copyrighted work of the attributed author or publisher, and
ZFIN has permission only to display this image to its users.
Additional permissions should be obtained from the applicable author or publisher of the image.
Full text @ Dev. Genes Evol.