
IMAGE
Fig. 6
- ID
- ZDB-IMAGE-161118-13
- Genes
- Publication
- Aspatwar et al., 2015 - Inactivation of ca10a and ca10b Genes Leads to Abnormal Embryonic Development and Alters Movement Pattern in Zebrafish
- All Figures
- Figures for Aspatwar et al., 2015
Image
|
Figure Caption
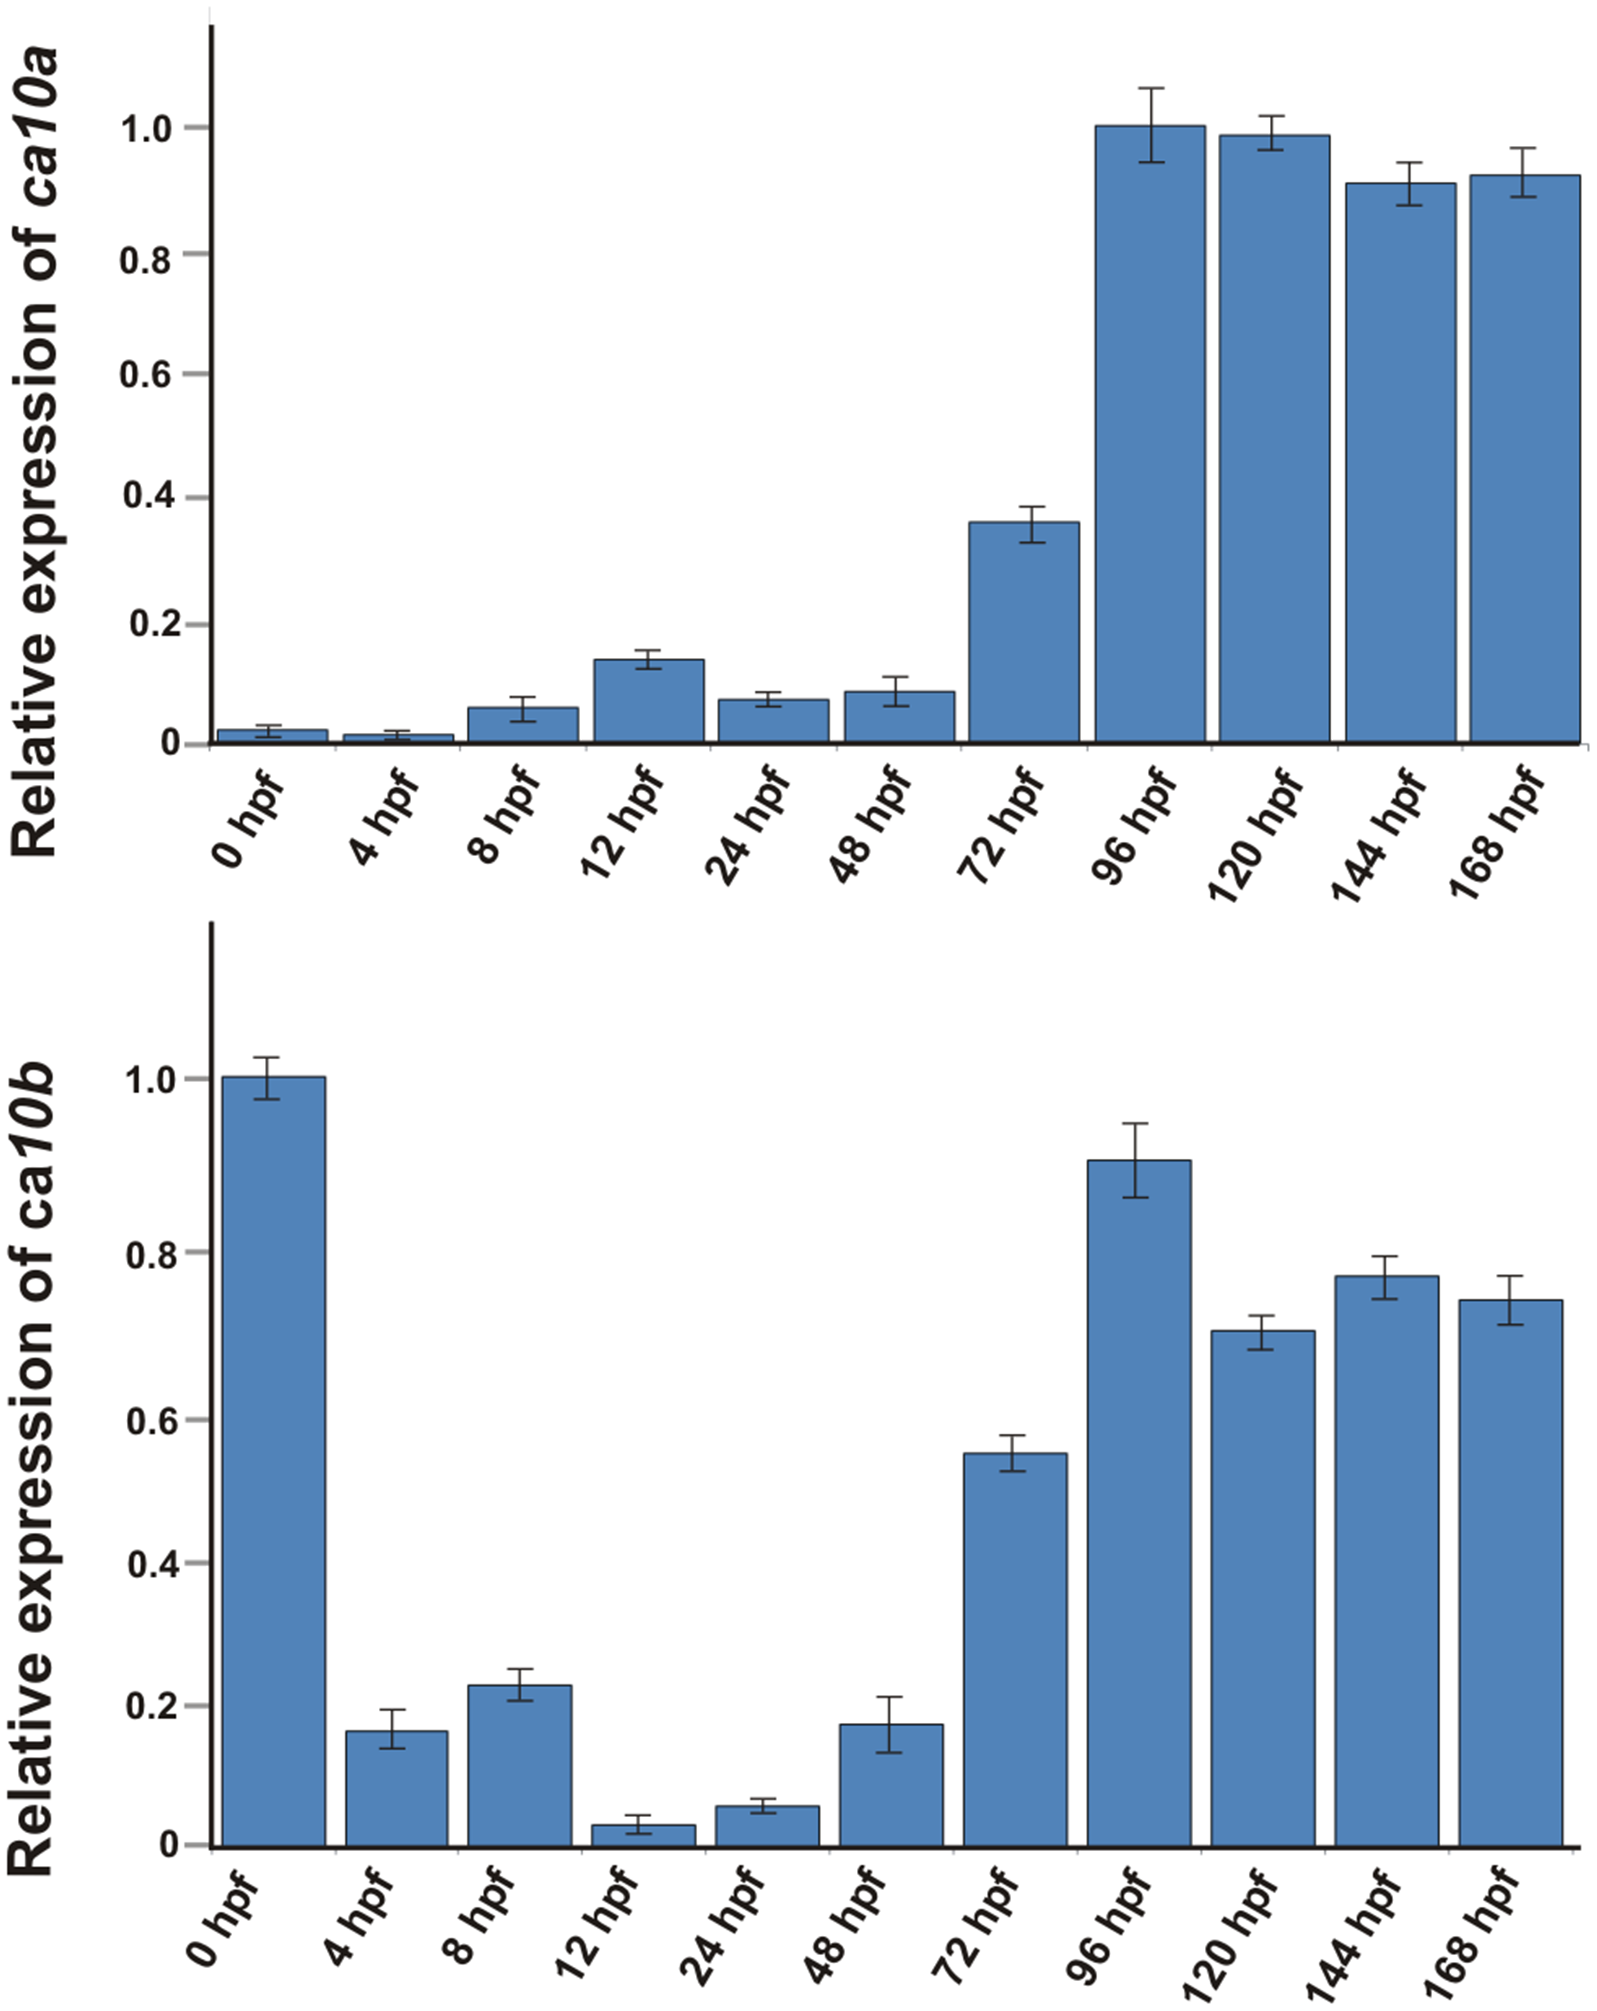
Fig. 6
Expression analysis of ca10a and ca10b mRNAs during embryonic development.
The expression levels of ca10a and ca10b were measured from the total mRNA isolated from the developing larvae of 0–168 hpf. A) Expression values of ca10a mRNA. B) Expression values of ca10b mRNA. The expression values were normalized to the beta actin control according to the equation of Pfaffl [34]. The expression of ca10a gene at 0 hpf and ca10b at 96 hpf assigned a relative value of 1.
Figure Data
Acknowledgments
This image is the copyrighted work of the attributed author or publisher, and
ZFIN has permission only to display this image to its users.
Additional permissions should be obtained from the applicable author or publisher of the image.
Full text @ PLoS One