
|
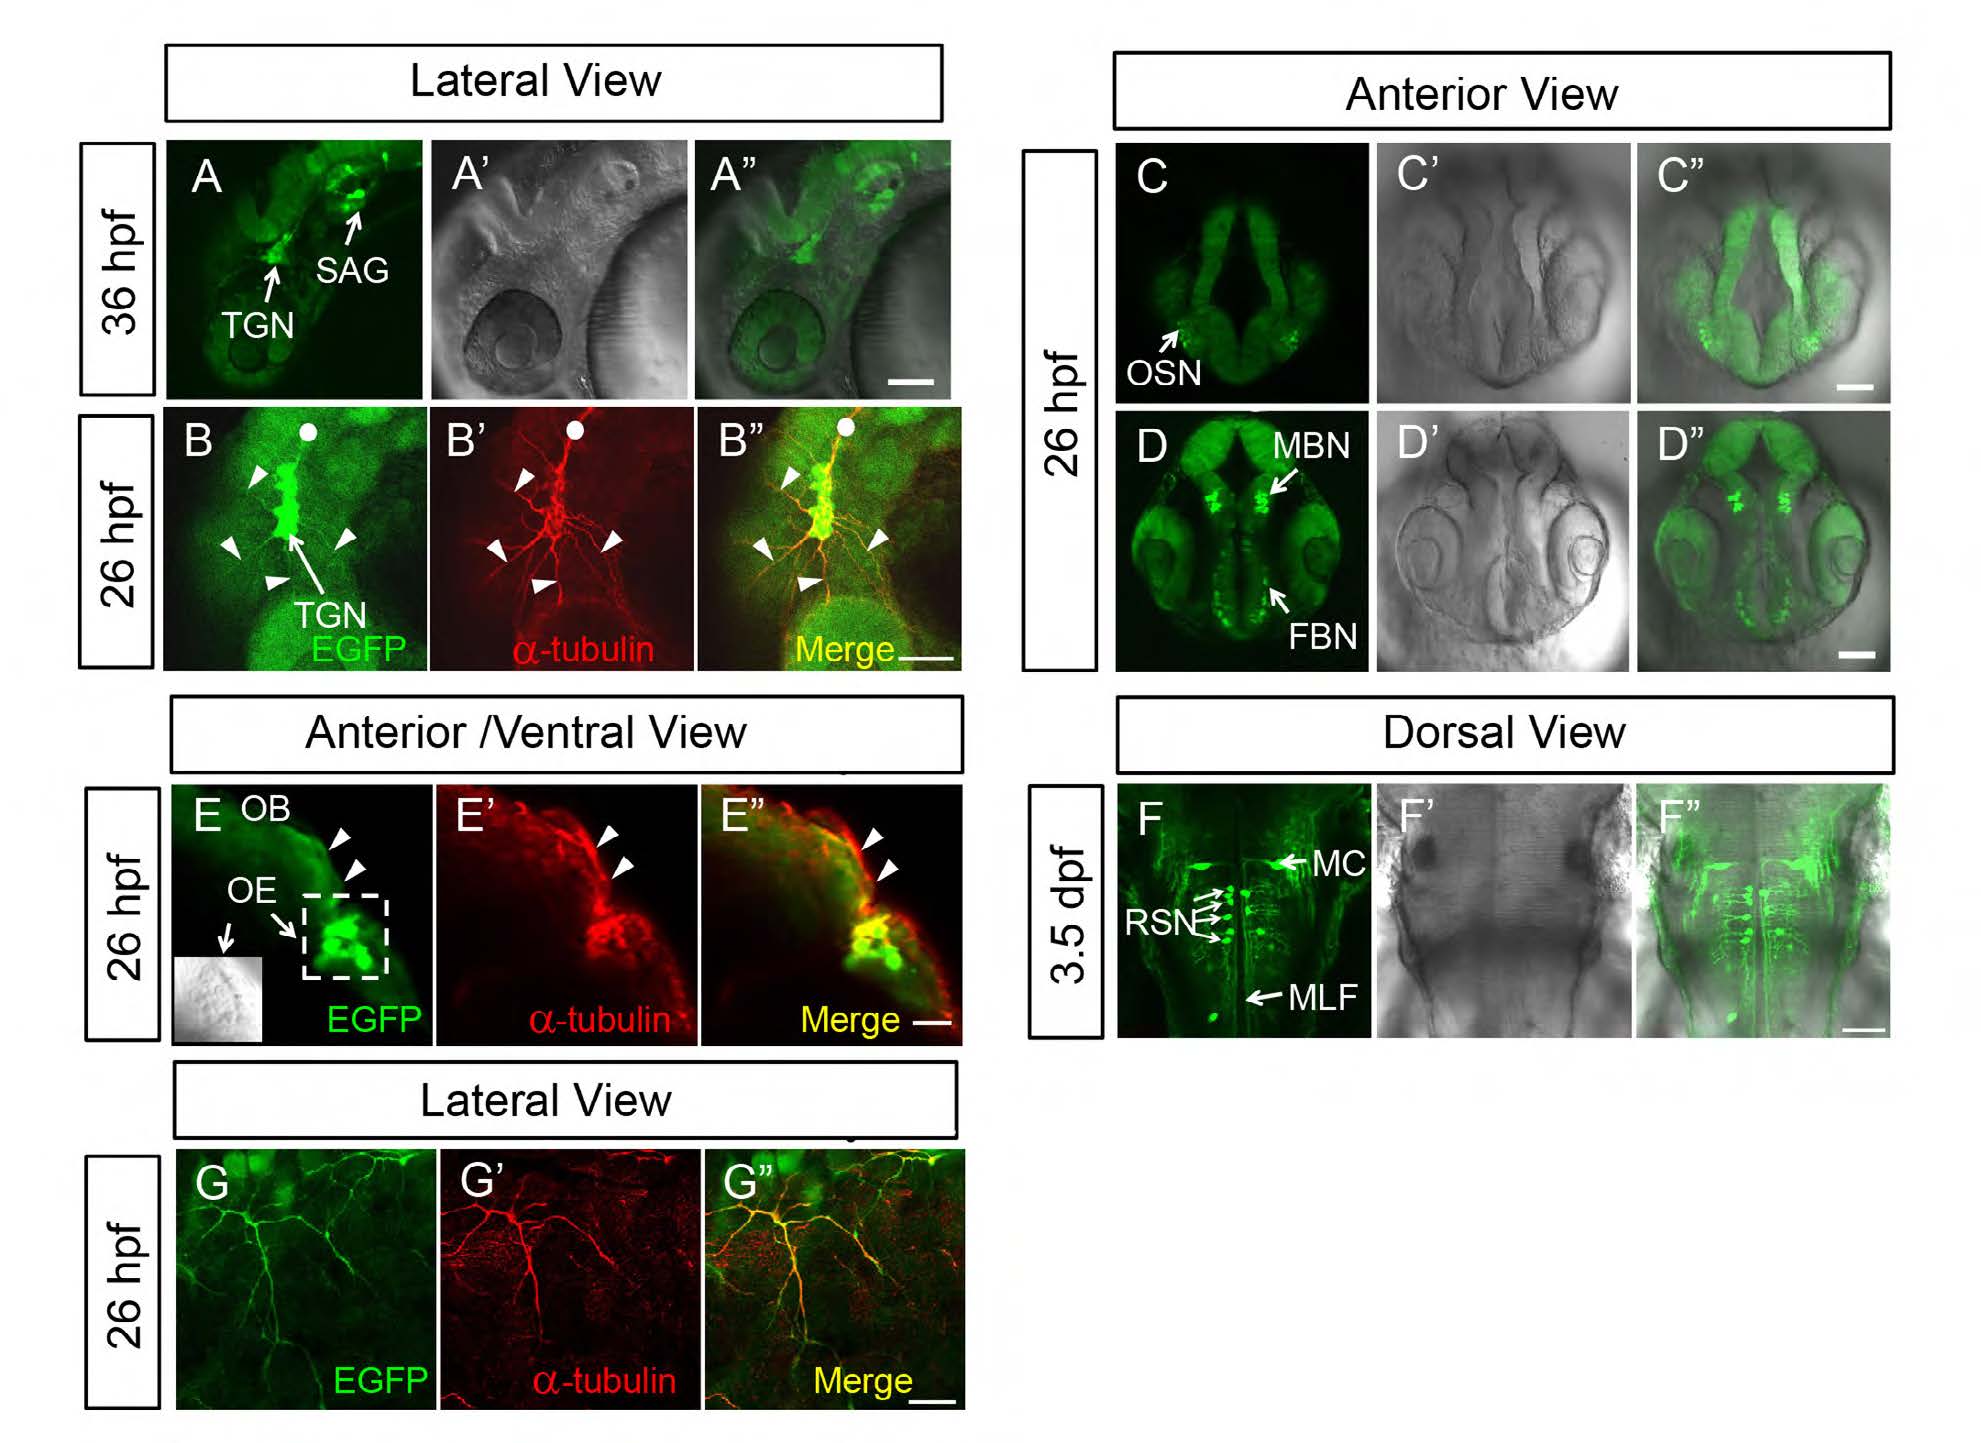
Fig. S3
Expression patterns of the trapped gene in other neurons. (A-A′′) GFP expression in TGN and SAG in 36-hpf embryos. (B-B′′) Acetylated a-tubulin expression in TGN in 26-hpf embryos (circle, central axon; arrowheads, peripheral axons). (C-D′′) GFP expression in OSN, FBN and MBN in 26-hpf embryos. (E-E′′) Acetylated a-tubulin in OSN in 26-hpf embryos (square, OE; arrowheads, axons projected from OSN to OE). (F-F′′) GFP expression in MC, RSN and their afferents (MLF) in 3.5-dpf embryos. (G-G′′) Acetylated a-tubulin in RB in 26-hpf embryos. FBN, forebrain neurons; MBN, midbrain neurons; MC, Mauthner cells; MLF, medial longitudinal fasciculus; OB, olfactory bulb; OE, olfactory epithelium; OSN, olfactory sensory neurons; RSN, reticulospinal neurons; SAG, statoacoustic ganglion neurons; TGN, trigeminal neurons. Scale bars: 50 µm in A-D′′,F-F′&prime& 20 µm in E-E′′,G-G′′.