
Fig. 6
- ID
- ZDB-IMAGE-161018-6
- Genes
- Publication
- Lu et al., 2016 - IGFBP1 increases β-cell regeneration by promoting α- to β-cell transdifferentiation
- All Figures
- Figures for Lu et al., 2016
|
Fig. 6
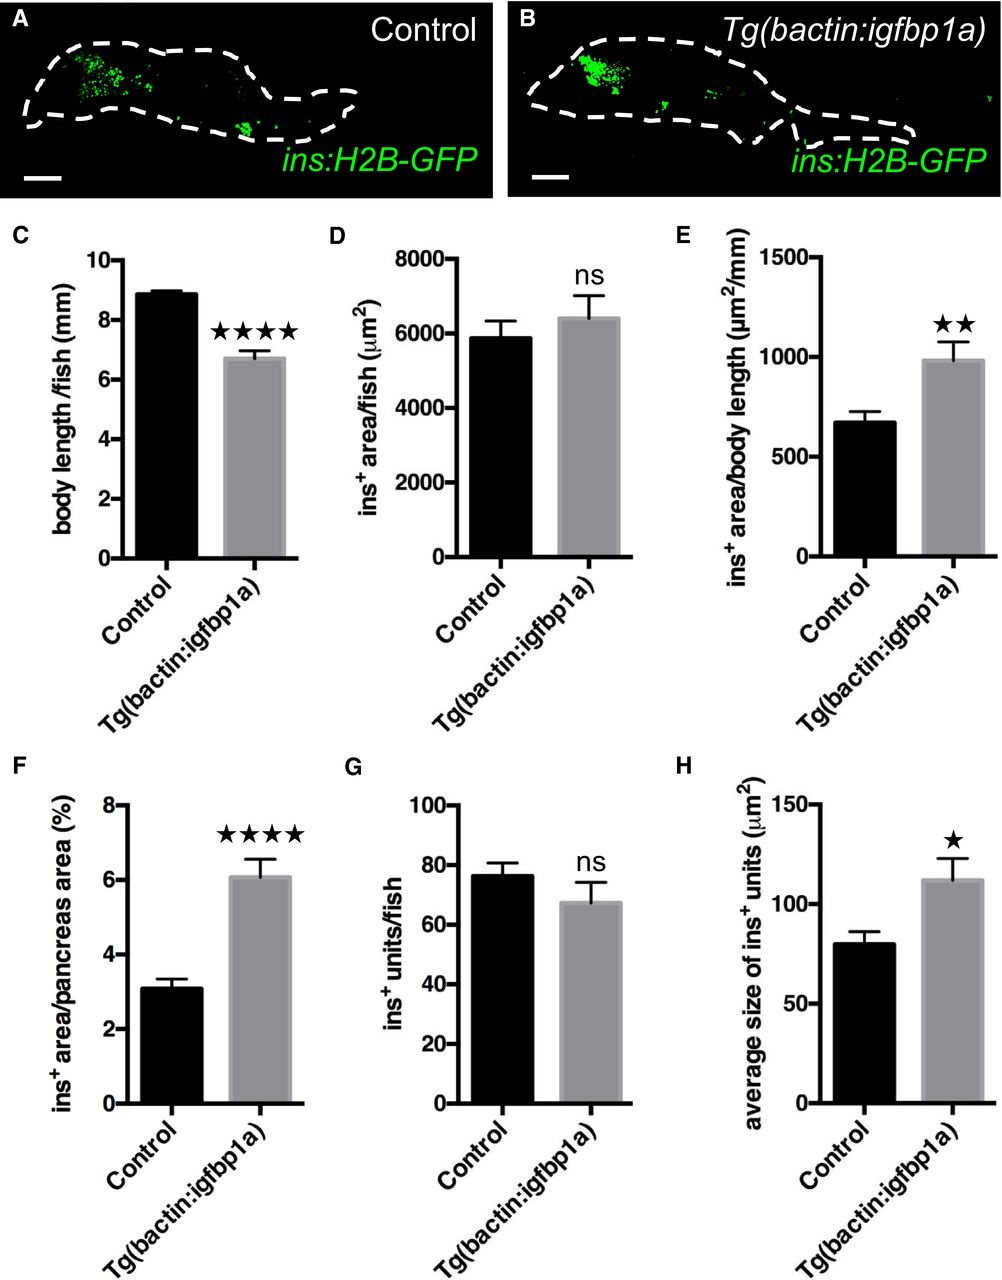
Igfbp1a also increases βcell regeneration in 1 month old zebrafish
A, B. Representative confocal projections of the whole pancreas (dashed lines) of 35dayold Tg(ins:H2BGFP);Tg(ins:FlagNTR) transgenics, with or without Tg(bactin:igfbp1a), that were subjected to βcell ablation between day 30 and 31 and then allowed to regenerate for 4 days. Scale bars represent 100 µm.
C. Body length of control and Tg(bactin:igfbp1a) zebrafish; ****P < 0.0001.
D-H. Quantification of βcell regeneration was automated with an ImageJ script. (D) Insulinpositive area per zebrafish. (E) Relative insulinpositive area per body length; **P < 0.01. (F) The percentage of the pancreas area that was insulinpositive was significantly larger in Tg(bactin:igfbp1a) than in controls; ****P < 0.0001. (G) The total number of recorded units of adjacent ins:H2BGFP+ pixels (units ranging from single β cells to βcell clusters) did not differ between control and Tg(bactin:igfbp1a) zebrafish. (H) The size of recorded ins:H2BGFP+ units was on average larger in Tg(bactin:igfbp1a) than in controls; *P = 0.039. n = 26 in the control group, n = 27 in the Tg(bactin:igfbp1a) group.