
|
Fig. S2
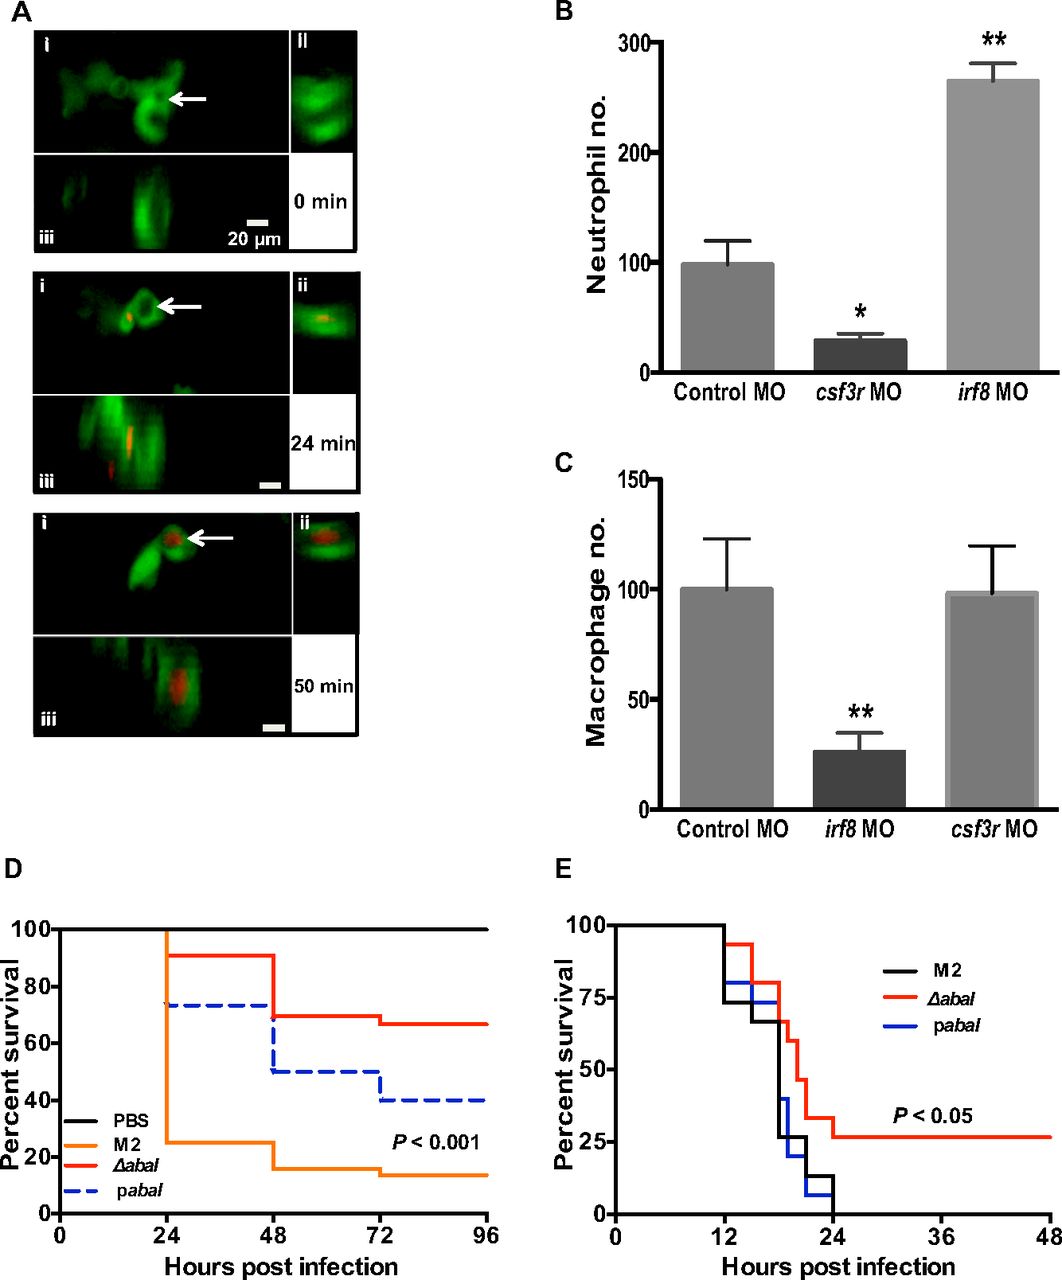
(A) After phagocytosis, A. baumannii is handled within acidic phagolysosomes as shown by the red fluorescence (pHrodo-dextran stain) within a neutrophilic vacuole (white arrow) at 50 min postinfection [Tg(mpx:GFP)il14 embryos with green fluorescent neutrophils were used]. In each panel, the maximum-projection z-stack image (i) is supplemented by x (ii) and y projections (iii). (B) Whole-embryo neutrophil numbers were counted using ImageJ at 48 hpf. Neutrophil numbers were decreased in csf3r MO-injected embryos and increased in irf8 MO-injected embryos (n = 15 per group pooled from three independent experiments; error bars represent mean ± SD). (C) Whole-embryo macrophage numbers were counted by using ImageJ at 48 hpf. Macrophage numbers were decreased in irf8 MO-injected embryos and were unchanged in csf3r MO-injected embryos. Asterisks represent comparison between control MO and csf3r MO or irf8 MO (n = 15 per group pooled from three independent experiments; error bars represent mean ± SD; *P ≤ 0.05 and **P < 0.01, one-way ANOVA, Kruskal-Wallis test). (D) Zebrafish infected with the Acinetobacter quorum-sensing mutant (ΔabaI) showed greater survival compared with wild-type Acinetobacter (M2 strain) and the complemented strain (pabaI) in zebrafish (P value is a comparison of M2 and ΔabaI) and (E) a murine septicemia model (n = 15 per group; P value is a comparison of M2 and ΔabaI by log-rank test).