
IMAGE
Fig. 2
Image
|
Figure Caption
Fig. 2
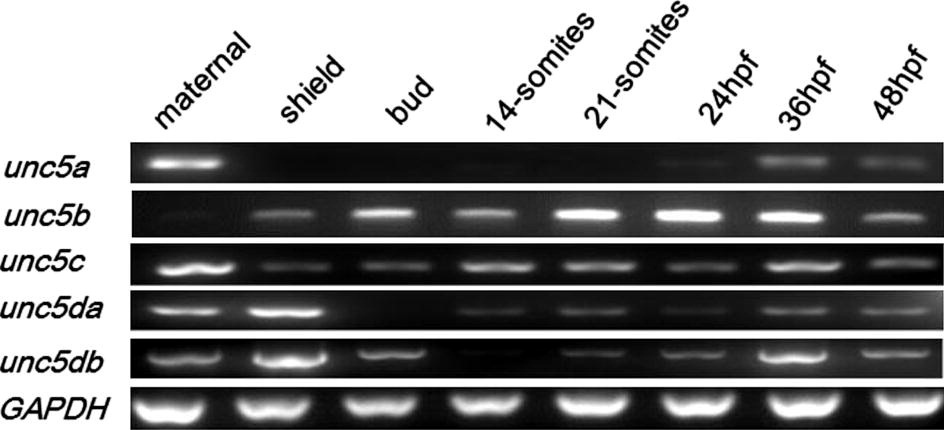
mRNA expression analysis of zebrafish unc5 family genes, unc5a, unc5b, unc5c, unc5da and unc5db. Amplification of GAPDH served as a control to calibrate the amount of the cDNA templates used in PCR reaction.
Figure Data
Acknowledgments
This image is the copyrighted work of the attributed author or publisher, and
ZFIN has permission only to display this image to its users.
Additional permissions should be obtained from the applicable author or publisher of the image.
Reprinted from Gene expression patterns : GEP, 13(8), Yang, B., Peng, G., and Gao, J., Expression of unc5 family genes in zebrafish brain during embryonic development, 311-8, Copyright (2013) with permission from Elsevier. Full text @ Gene Expr. Patterns