
|
Fig. 4
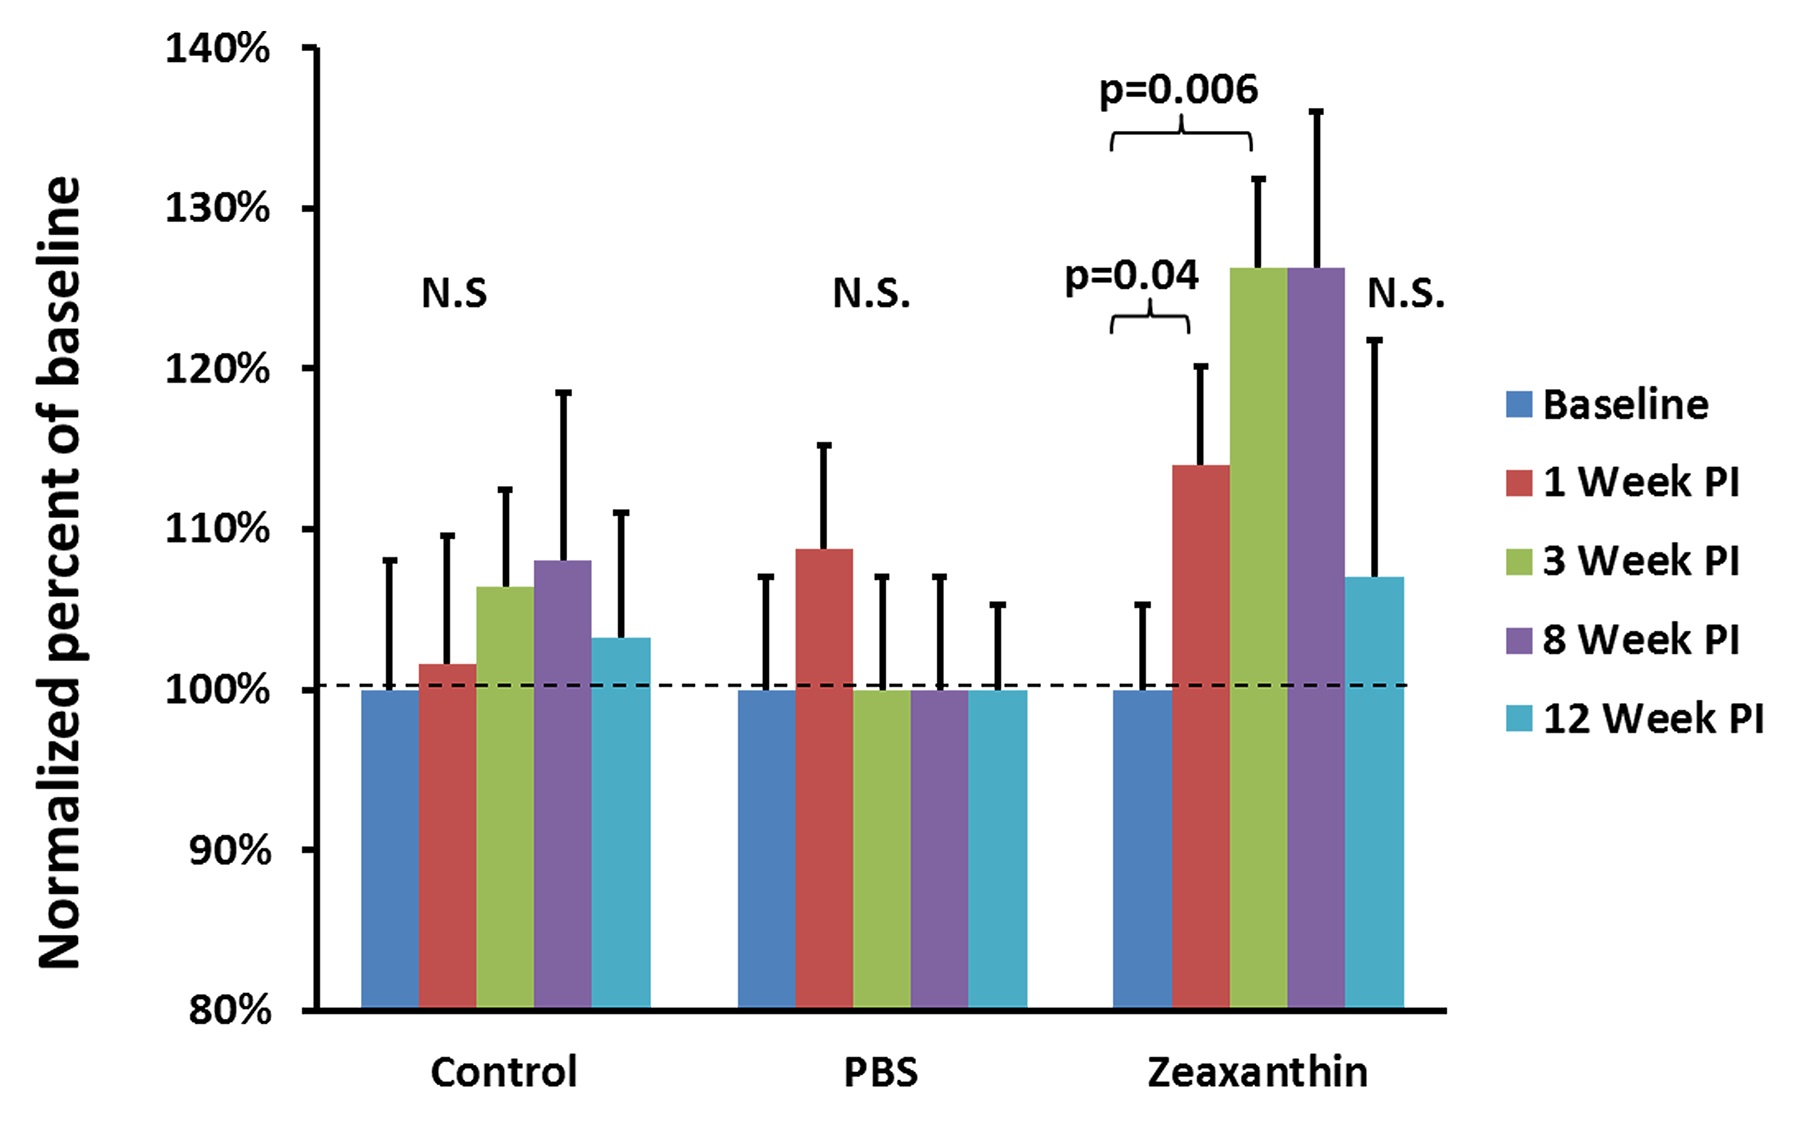
Normalized visual acuity measurements represented as a percent of baseline after injections.
The values presented are mean percentages normalized to baseline means for each group. Control fish (n = 17) did not receive an injection and their visual acuity did not significantly (N.S.) change. The PBS group (n = 13) received an equivalent volume of PBS injected into their eyes and did not show a significant change compared to baseline post injection (PI). The group injected with zeaxanthin (n = 13) had an increased visual acuity at 1 and 3 weeks PI and then saw a return to approximate baseline acuity levels by 12 weeks. Error bars represent normalized standard errors. The dotted line identifies the normalized starting visual acuity for each group.