
Fig. 5
- ID
- ZDB-IMAGE-160729-13
- Publication
- Cheng et al., 2014 - Myotonia Congenita-Associated Mutations in Chloride Channel-1 Affect Zebrafish Body Wave Swimming Kinematics
- All Figures
- Figures for Cheng et al., 2014
|
Fig. 5
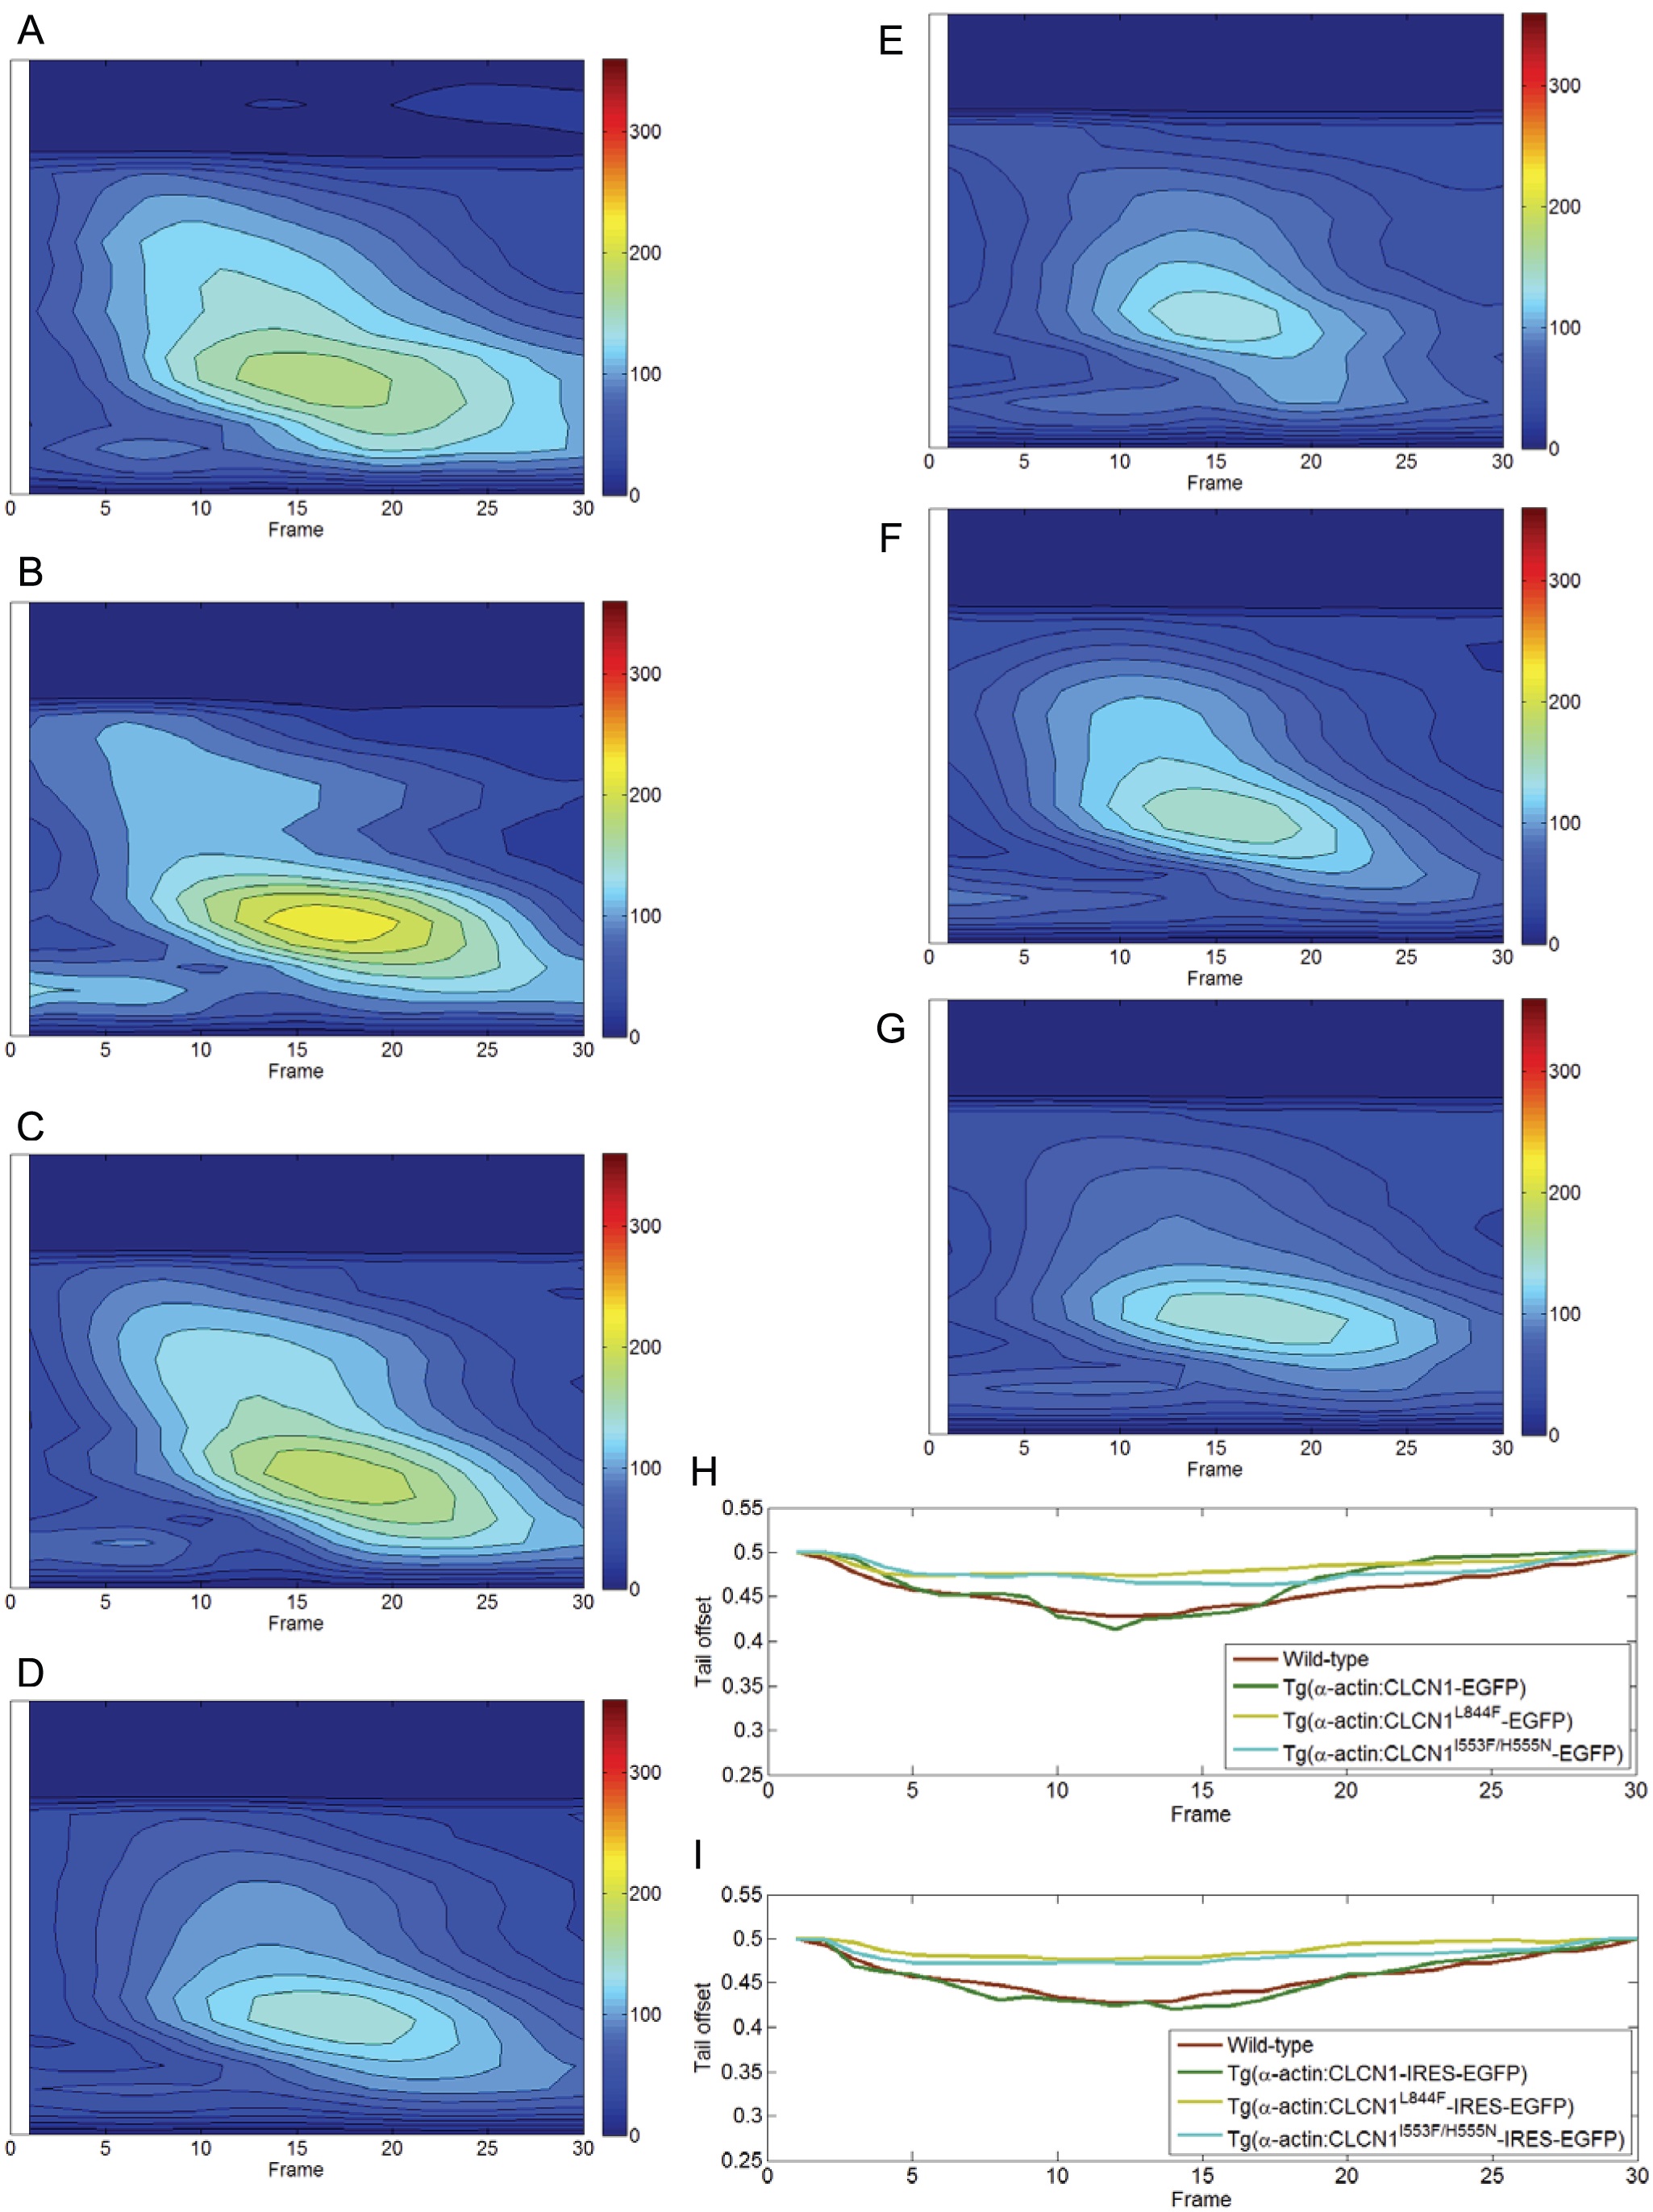
The comparison of averaging spatial-temporal body curvature profiles and averaging temporal tail offset profiles.
For each zebrafish, 16-second video sequences at high frame rates were recorded. The video clip was manually split into smaller clips containing one full body waving cycle. The fish body was tracked and the bending degree determined using body curvature and tail offset as criteria. (A-G) averaging spatial-temporal body curvature profiles that are obtained from the following zebrafish: wild-type, hCLCN1-EGFP, hCLCN1L844F-EGFP, hCLCN1I553F/H555N-EGFP, hCLCN1-IRES-EGFP, hCLCN1L844F-IRES-EGFP, hCLCN1I553F/H555N-IRES-EGFP, respectively. We consolidated body curvature measurements calculated at each frame into a matrix. Each column represents the body curvature measurements in one frame. The number of columns is equal to the number of frame of one body waving cycle. We further averaged matrices over all body waving cycles of all zebrafish within same category to obtain an averaging body curvature profile. Red color indicates higher curvature value and larger bending of fish body. The Y-axis represents the body curvature measurements in one frame. The X-axis represents frame index of one video segment of one body waving cycle. (H-I) Consolidated tail offset measurements calculated at each frame into a vector. The vectors are averaged over all body waving cycles of all zebrafish within same category to obtain an averaging tail offset profile. Larger tail offset value indicates smaller bending of fish body.