
IMAGE
Fig. 6
- ID
- ZDB-IMAGE-160729-12
- Publication
- Cheng et al., 2014 - Myotonia Congenita-Associated Mutations in Chloride Channel-1 Affect Zebrafish Body Wave Swimming Kinematics
- All Figures
- Figures for Cheng et al., 2014
Image
|
Figure Caption
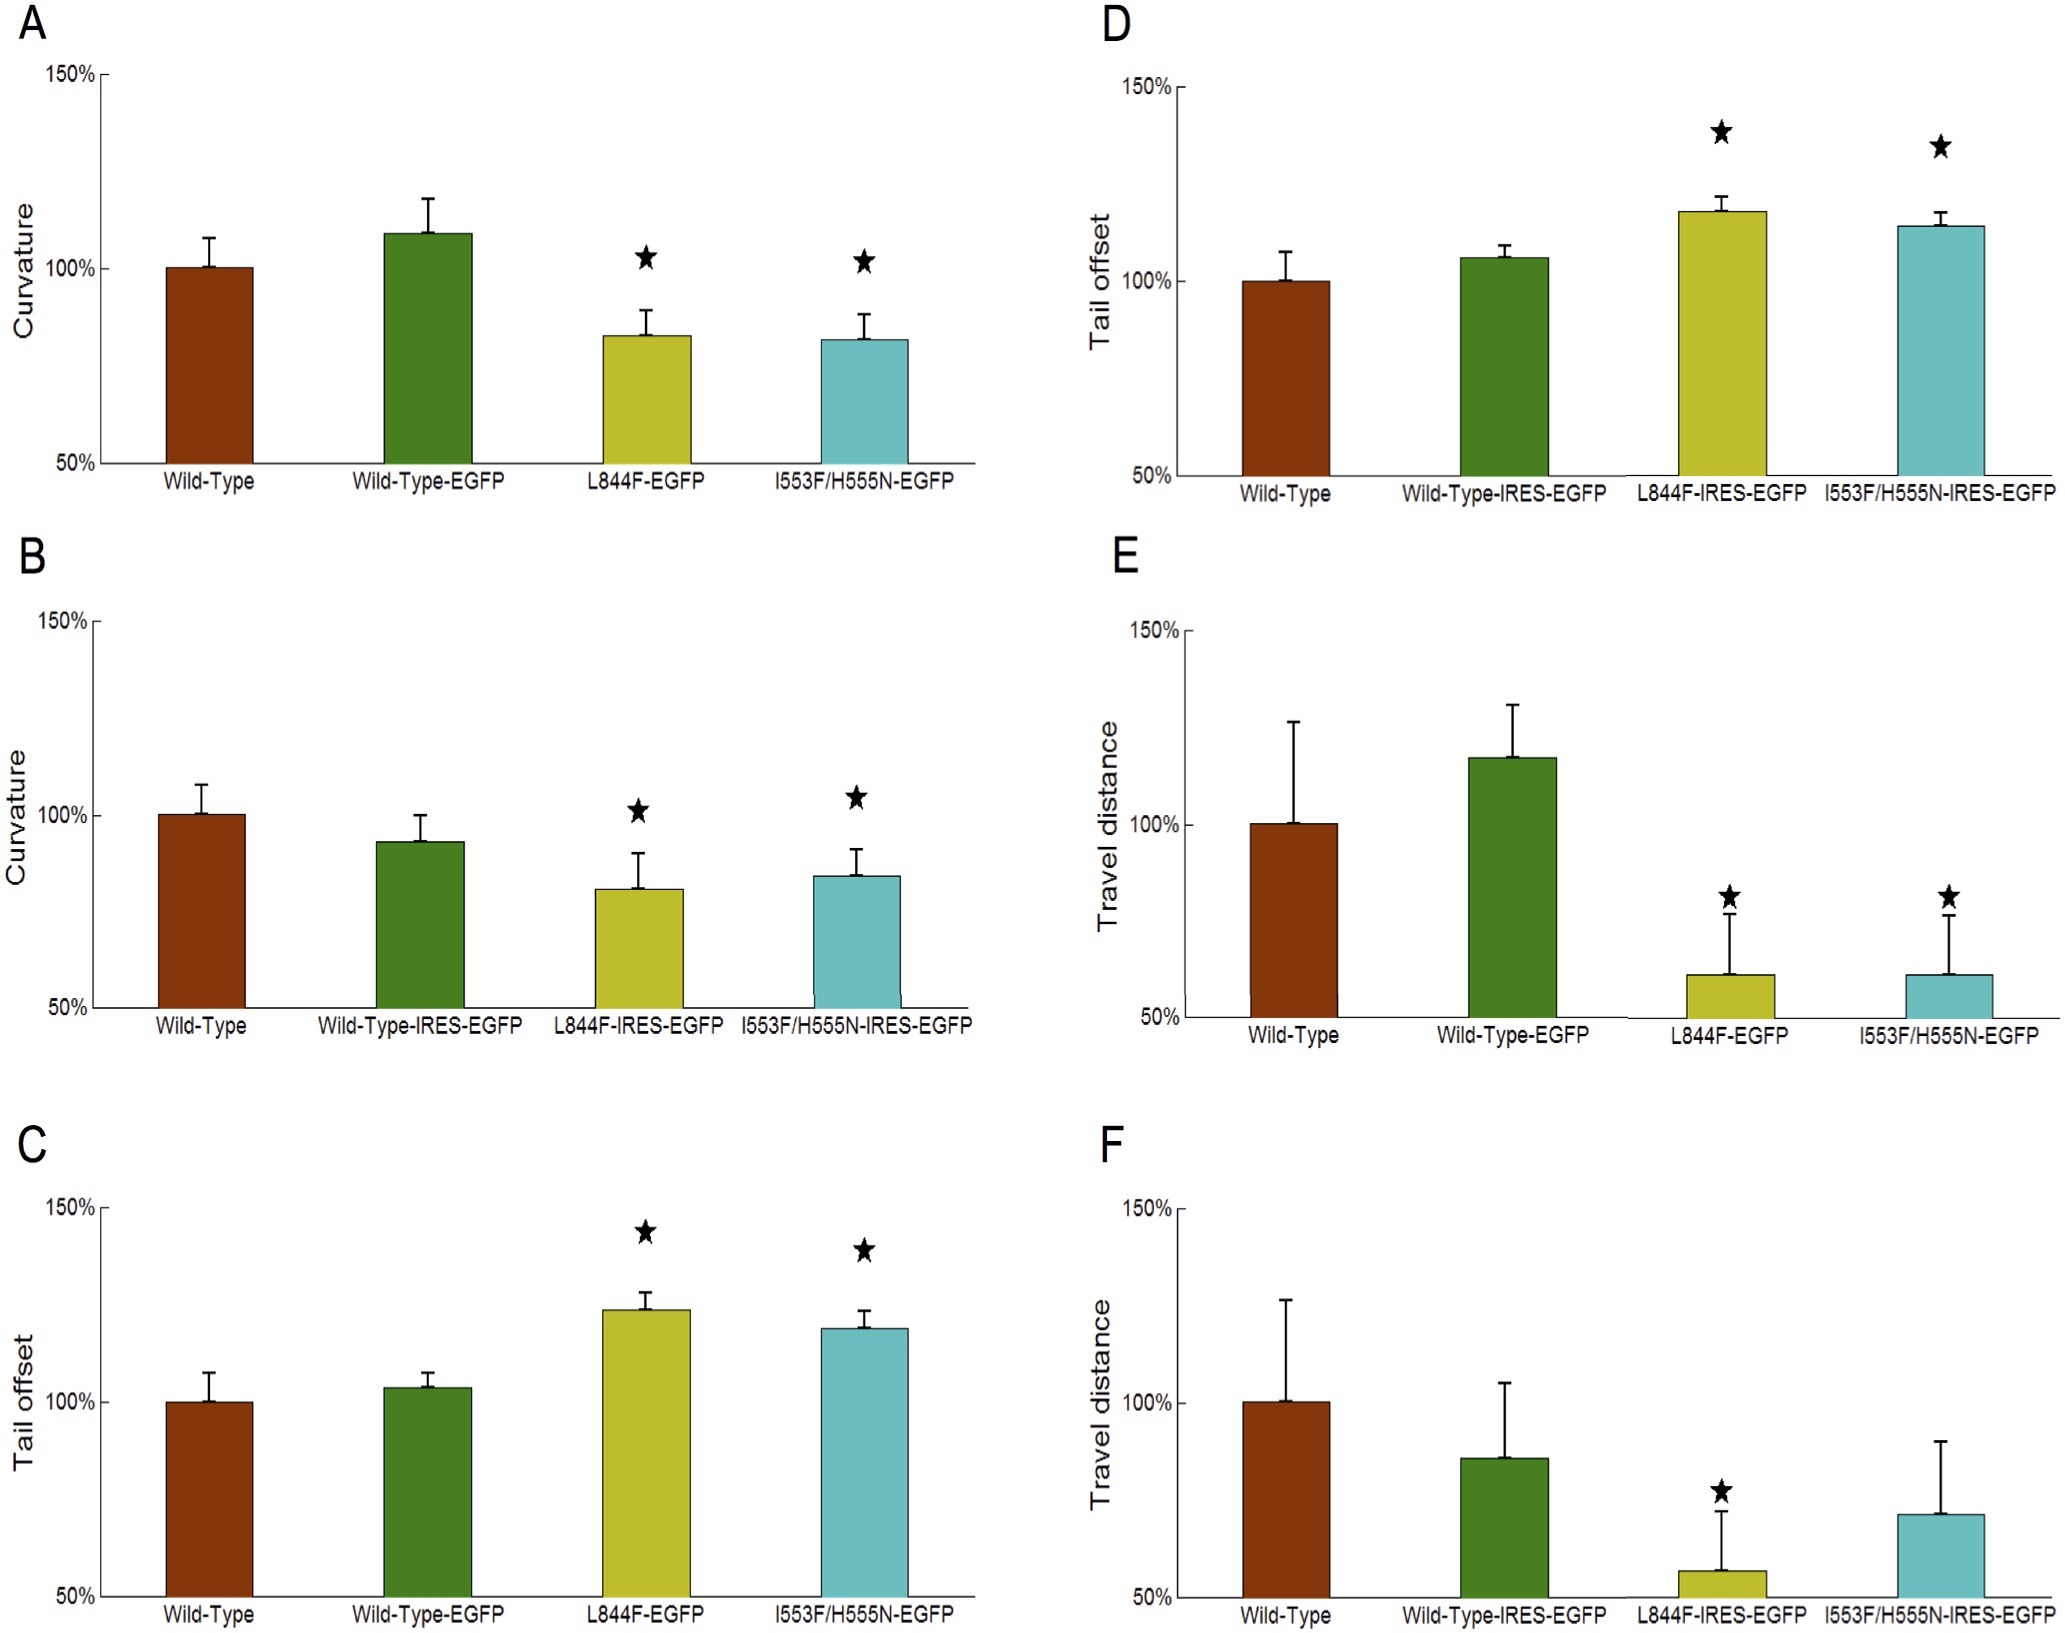
Fig. 6
Comparison of body curvature, tail offset and swimming distance measurements between wild-type, control and transgenic zebrafish.
We selected the largest body curvature value (A-B); smallest tail offset value (C-D), and travel distance (E-F) from each body waving cycle. All measurements are first averaged over all video clips within same category. The averaged measurements are further divided by the mean measurement of wild-type zebrafish. The measurements are plotted as mean +/ standard deviation. The star symbol in the figure indicates a significant difference (p<0.05) in the Student-t test.
Figure Data
Acknowledgments
This image is the copyrighted work of the attributed author or publisher, and
ZFIN has permission only to display this image to its users.
Additional permissions should be obtained from the applicable author or publisher of the image.
Full text @ PLoS One