
Fig. S1
- ID
- ZDB-IMAGE-160729-10
- Genes
- Publication
- Hartwig et al., 2014 - Temporal control over the initiation of cell motility by a regulator of G-protein signaling
- All Figures
- Figures for Hartwig et al., 2014
|
Fig. S1
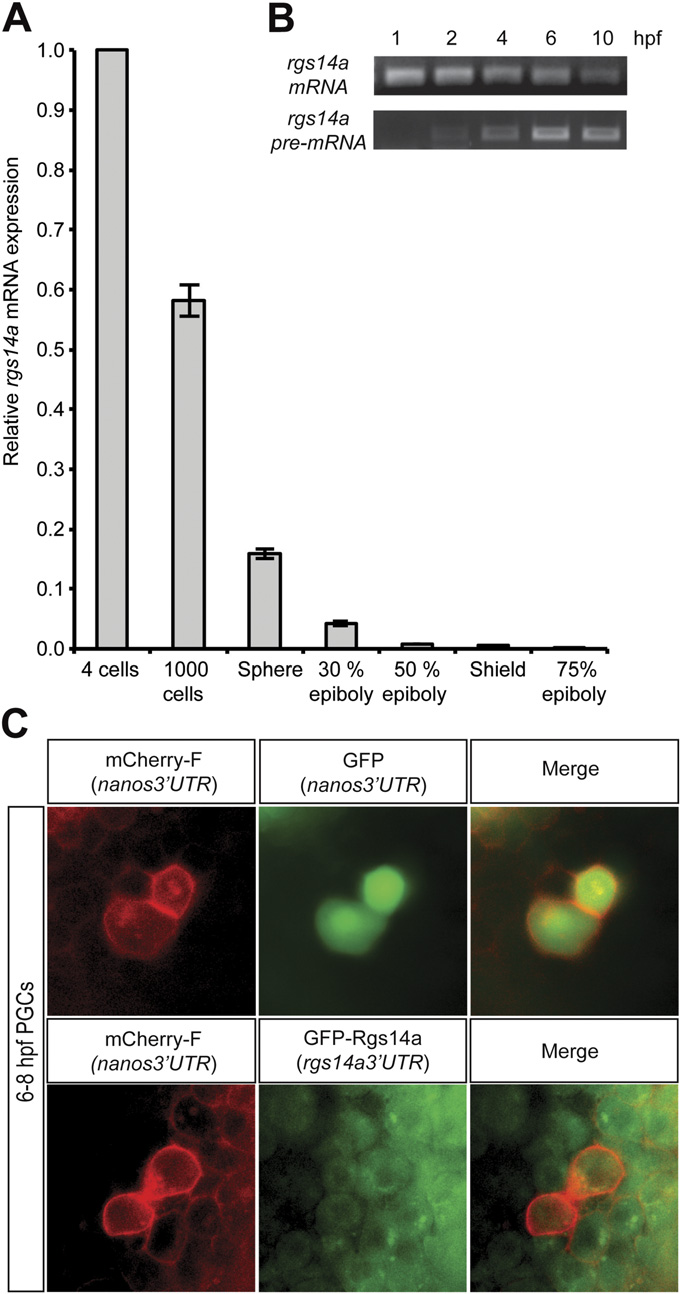
(A) qPCR analysis of rgs14a mRNA showed gradual decrease of maternally provided RNA between the four-cell and 75% epiboly stages. (B) Performing RT-PCR for either total rgs14a mRNA or specifically for the unspliced pre-mRNA pool reveals that the gene is zygotically expressed. (C) Injection of mRNA encoding for mCherry cloned upstream of the nanos3′UTR together with mRNA encoding for GFP cloned upstream of the nanos3′UTR results in enriched expression of both fluorescent proteins in the PGCs (Upper). In contrast, injection of mRNA encoding for mCherry cloned upstream of the nanos3′UTR together with mRNA encoding for GFP fused to the ORF of the Rgs14a protein cloned upstream of the rgs14a3′UTR results in uniform GFP expression in all cells of the embryo (Lower).