
Fig. S5
- ID
- ZDB-IMAGE-160713-26
- Publication
- Uemura et al., 2016 - Yap/Taz transcriptional activity in endothelial cells promotes intramembranous ossification via the BMP pathway
- All Figures
- Figures for Uemura et al., 2016
|
Fig. S5
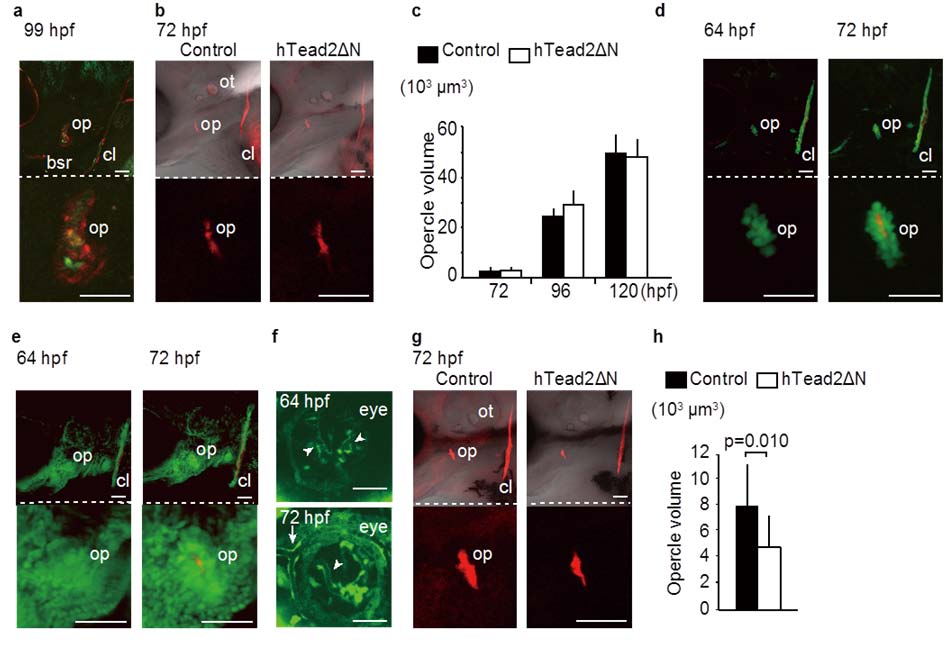
Inhibition of Yap/Taz transcriptional activity in osteoblast cells affects little in the opercle formation. (a) Stacked images of Tg(osterix: gal4-htead2ΔN): (UAS: GFP) at indicated hpf are shown. Green color represents Yap/Taz transcriptional activity. Bar: 50 µm. (b) and (c) Control embryos of Tg(osterix: gal4-vp16) and Tg(osterix: gal4-vp16): (UAS: GFP-htead2ΔN) were stained with alizarin red s, and measured the volume of opercle (op) at indicated hpf. Average and SD are calculated with more than 5 embryos in each sample. Bar: 50 µm. (d) Representative images of Tg(osterix: gal4-vp16): (UAS: GFP) at indicated hpf are shown. Bar: 50 µm. (e) and (f) Stacked images of Tg(runx2enhancer: gal4-vp16): (UAS: GFP) at indicated hpf are shown. Green color represents GFP expression. In (f), a stacked image in longer exposure is shown. In upper panel, left arrowheads indicate hyaloid vessels. In lower panel, left arrows indicates superficial annular vessel. Right arrowhead indicates hyaloid vessels. Bar: 50 µm. (g) and (h) Similar experiments were performed as (b) and (c) by using Tg(runx2enhancer: gal4-vp16): (UAS: GFP-htead2ΔN). Average and SD are calculated with more than 10 embryos in each sample. Bar: 50 µm.