
IMAGE
Fig. S3
- ID
- ZDB-IMAGE-160713-24
- Publication
- Uemura et al., 2016 - Yap/Taz transcriptional activity in endothelial cells promotes intramembranous ossification via the BMP pathway
- All Figures
- Figures for Uemura et al., 2016
Image
|
Figure Caption
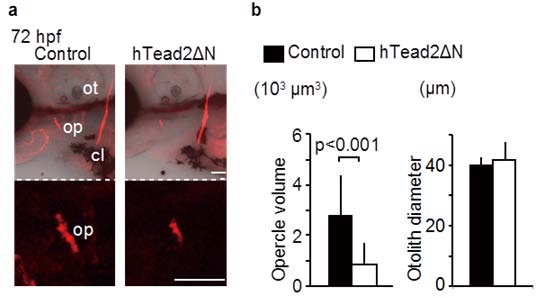
Fig. S3
The Tg(flk1: gal4-vp16): (UAS: GFP-htead2ΔN) also shows osteogenesis retardation. (a) and (b) Control Tg(flk1: gal4-vp16) embryos and Tg(flk1: gal4-vp16): (UAS: GFP-htead2ΔN) were stained with alizarin red s, and the volume of the opercle (op) and the diameter of the otolith (ot) at indicated hours post fertilization (hpf) were measured. Average and SD were calculated from more than 15 embryos in each sample. Bar: 50 µm.
Acknowledgments
This image is the copyrighted work of the attributed author or publisher, and
ZFIN has permission only to display this image to its users.
Additional permissions should be obtained from the applicable author or publisher of the image.
Full text @ Sci. Rep.