
|
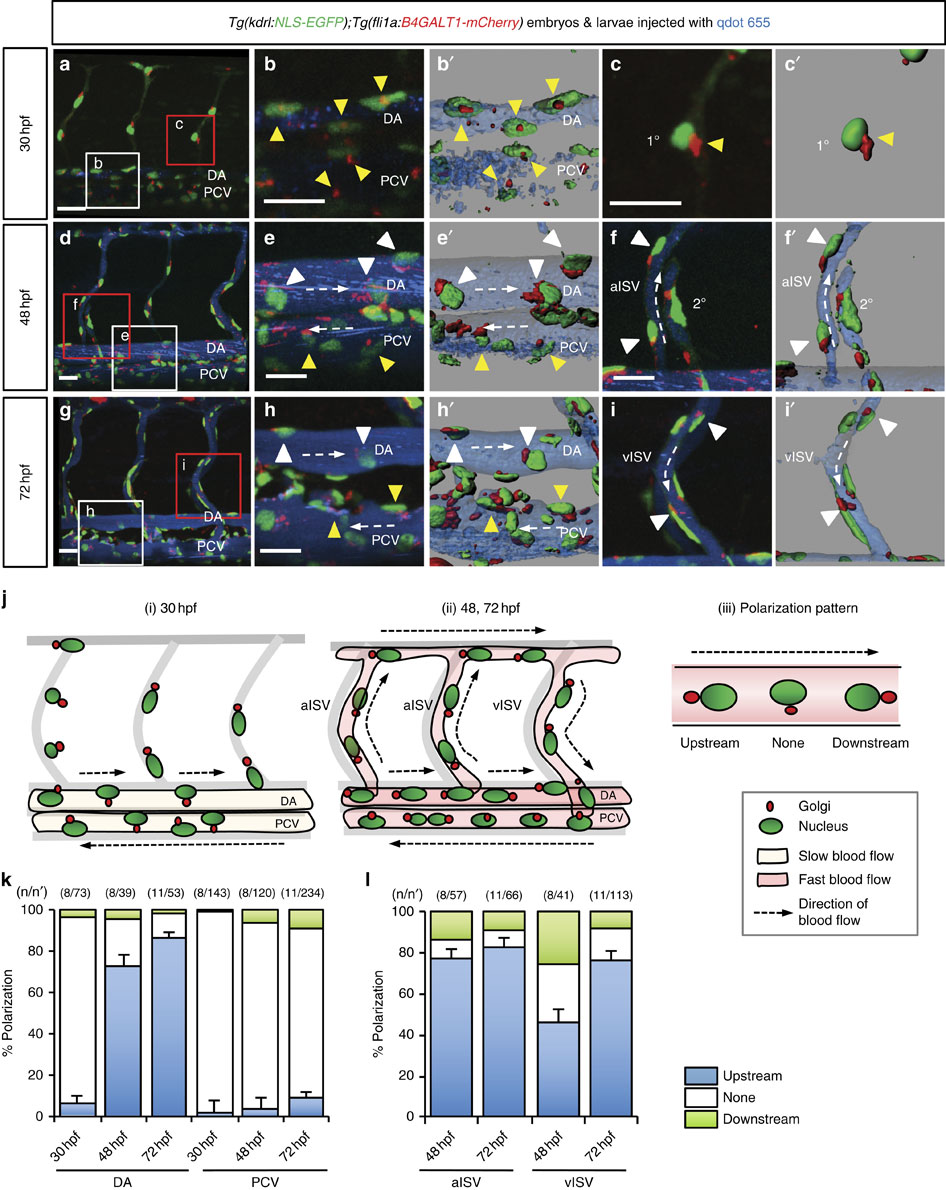
Fig. 1
EC polarization during development.
(a-i′) Three-dimensional-rendered confocal stack images of the trunk region of 30, 48 and 72 h.p.f. Tg(kdrl:NLS-EGFP);Tg(fli1a:B4GALT1-mCherry) animals injected intravascularly with qdot 655. The white and red boxes in the left panels (a,d,g) are enlarged in the middle (b,e,h) and right (c,f,i) panels, respectively. (b′,c′,e′,f′,h′,i′) Surface-rendered images of boxed regions. White dashed arrows indicate the direction of blood flow. White arrowheads point to polarized ECs and yellow arrowheads point to non-polarized ECs. (j) Schematic representation of EC polarization during development in the trunk region (i and ii) and illustration of the various polarization patterns (iii). (k,l) Quantification of EC polarization in the DA, PCV (k) and ISVs (l). The numbers of larvae (n) and ECs (n′) are indicated above the graph. Anterior to the left, dorsal to the top. Scale bars, 20 µm. aISV, arterial intersegmental vessel; DA, dorsal aorta; PCV, posterior cardinal vein; vISV, venous intersegmental vessel; 1°, primary sprouts; 2°, secondary sprouts. Error bars, s.e.m.