
|
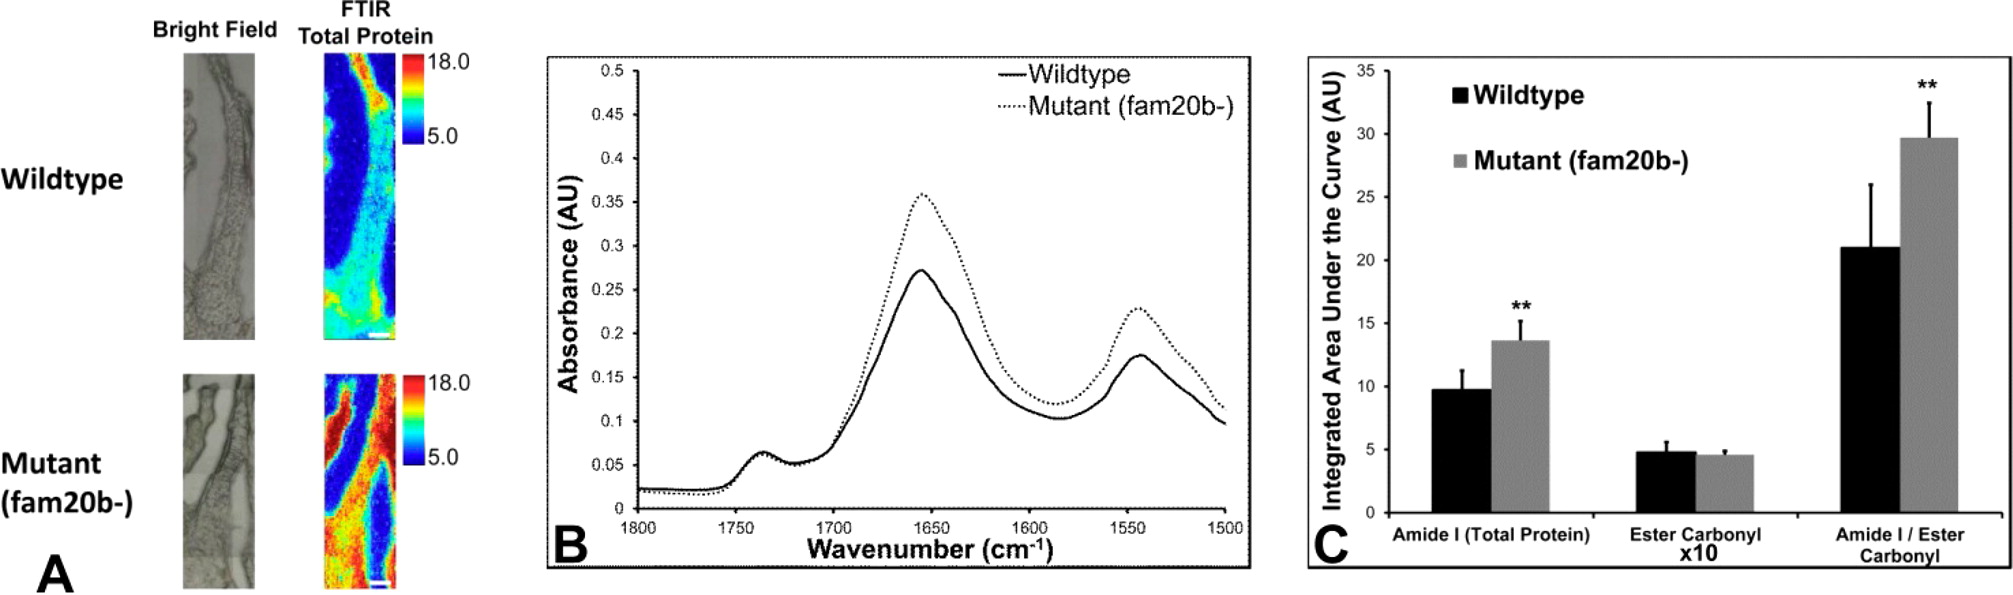
Fig. 8
FTIR spectroscopic imaging reveals a significant increase in total protein levels in cartilage from PG-deficient fam20b- mutant fish relative to wild-type fish. (A) FTIR spectroscopic images of total protein in wild-type and fam20b- mutant fish were generated from the integrated area under the amide I band (1600-1700 cm-1). (B) Representative average FTIR spectra from the entire cartilage region of interest in one wild-type fish and one fam20b- mutant fish. (C) Average values calculated from the integrated area under the curve for the amide I band (1600-1700 cm-1), the ester carbonyl band (1755-1715 cm-1), and the amide I/ester carbonyl ratio. The integrated area under the curve values for the ester carbonyl band have been multiplied by a factor of 10 for the sake of clarity.