
|
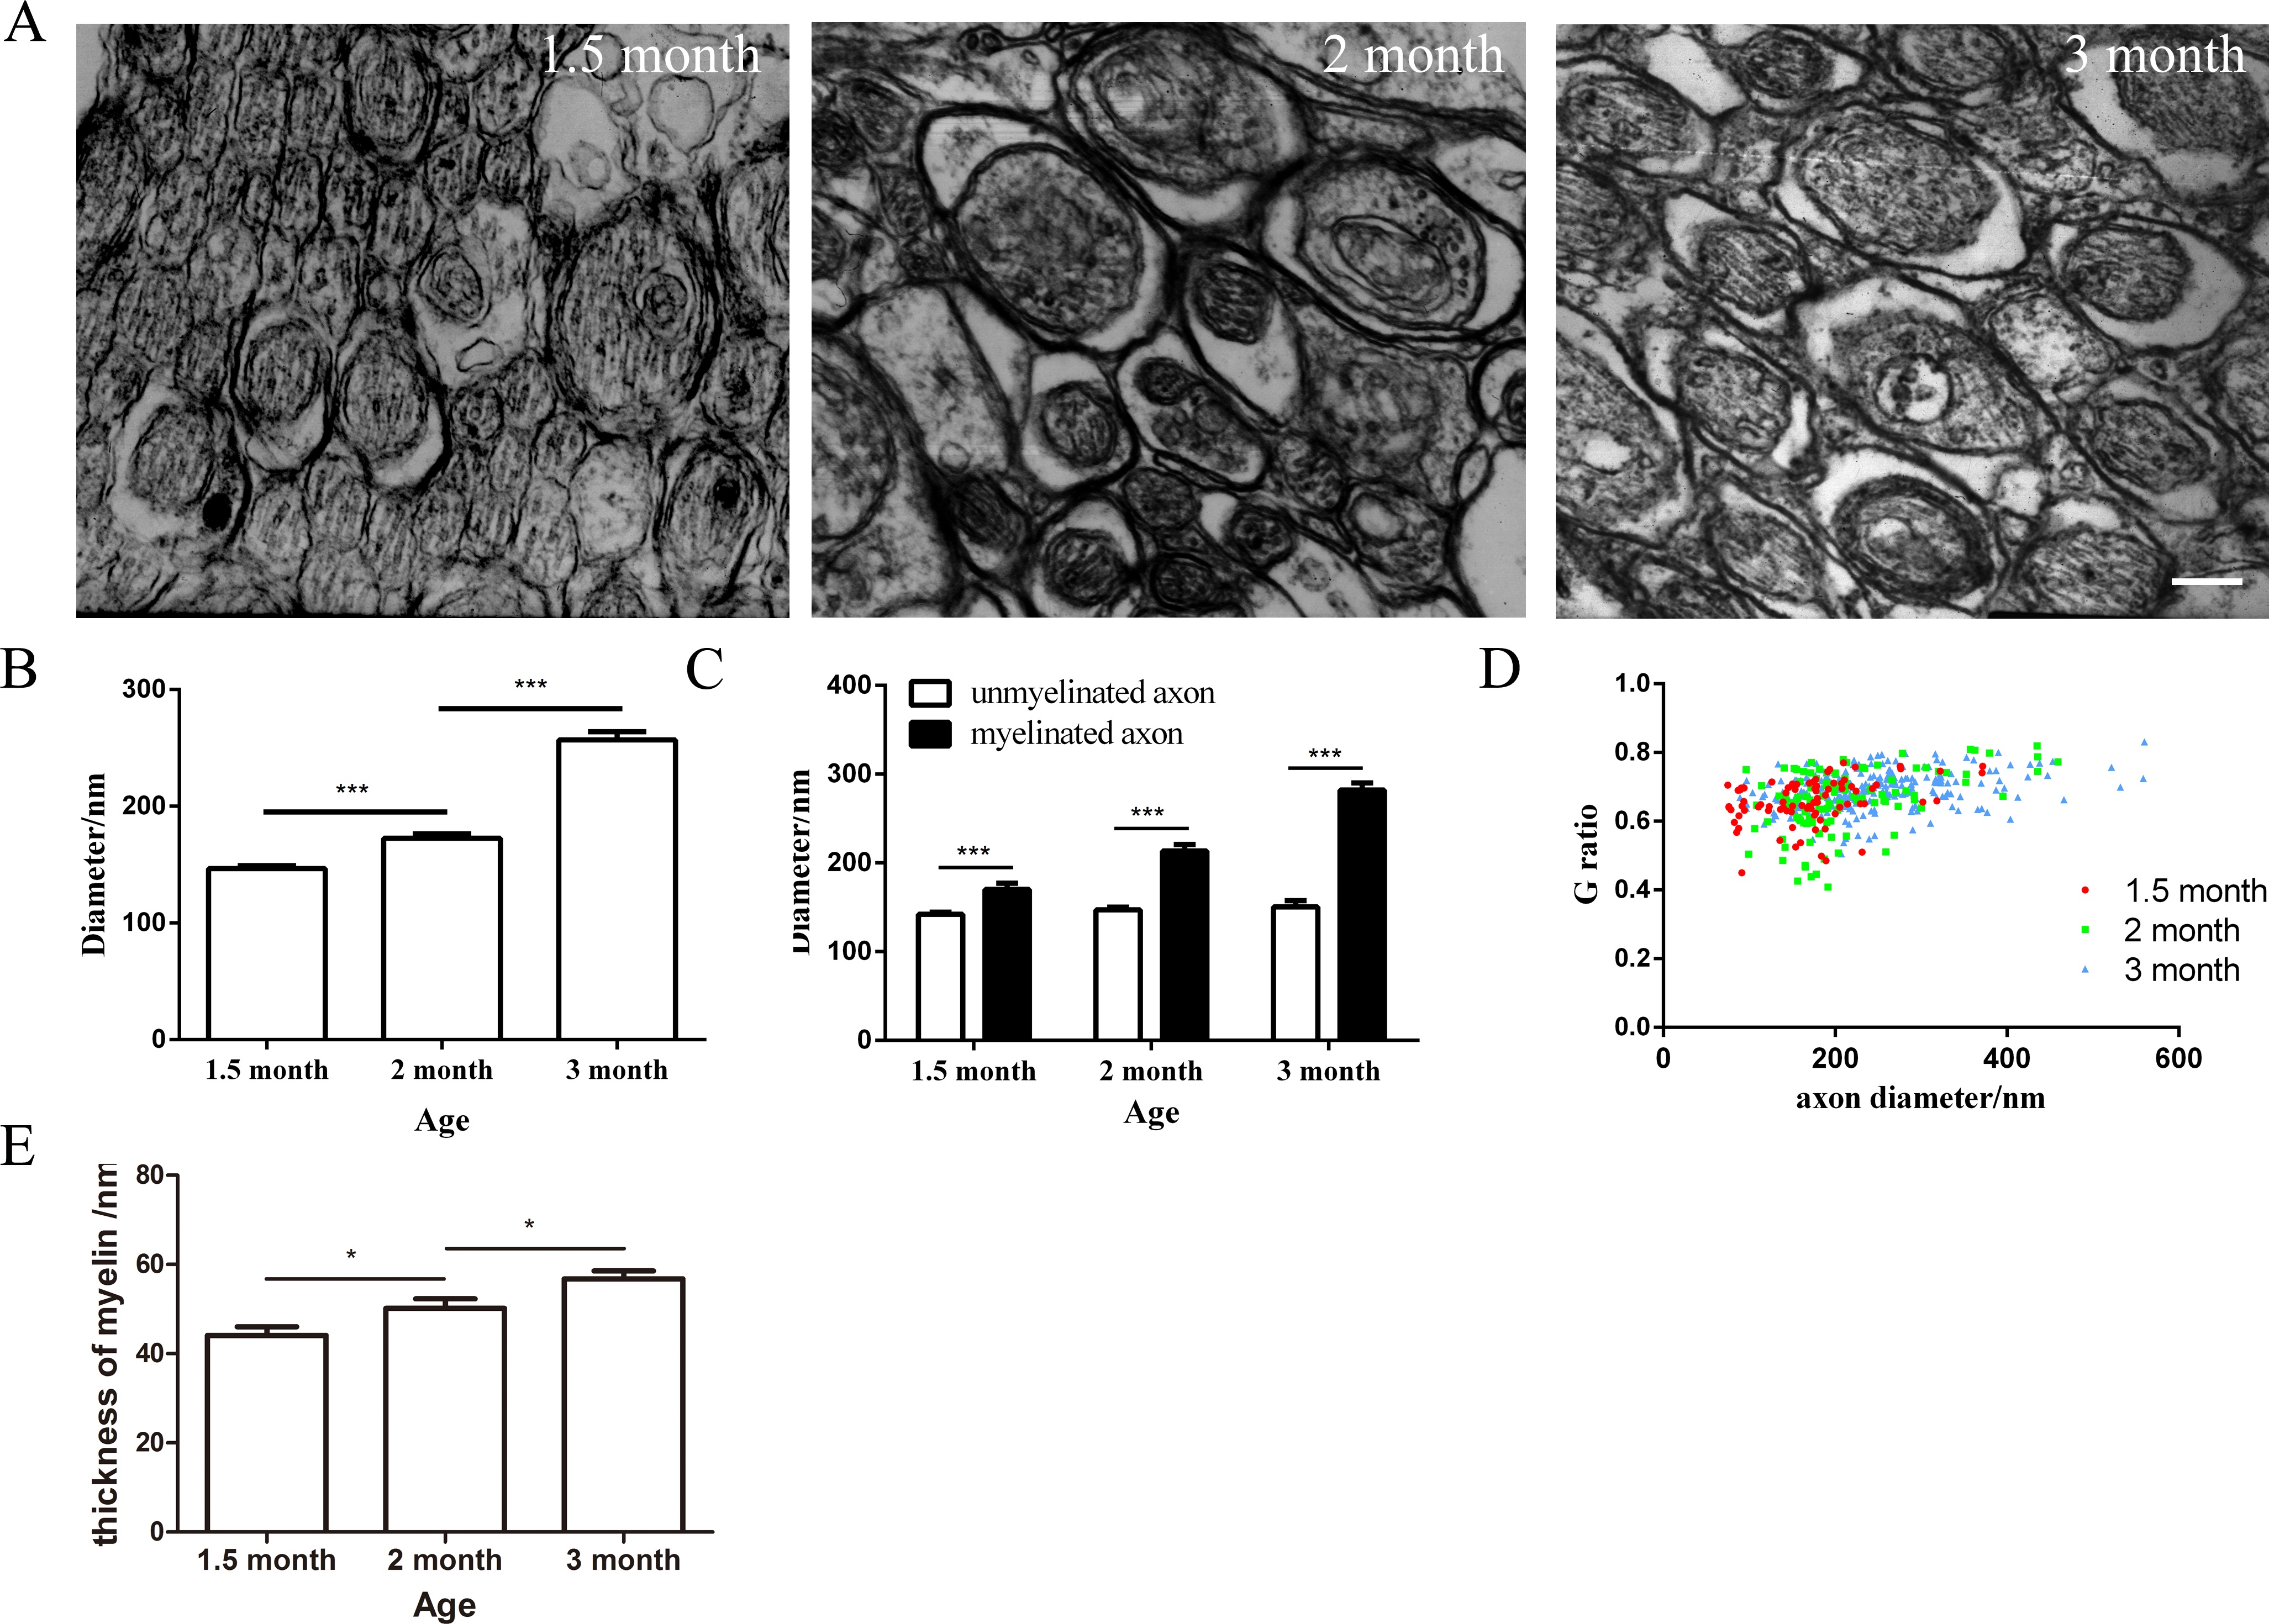
Fig. 5
The relationship between myelination and the axon diameter. (A) Electron micrographs of RGC axons in zebrafish retinas from 1.5 to 3.0 months. (B, C) Quantification of the axon diameter (n = 517, 295, and 311 at 1.5, 2.0, and 3.0 months, respectively), myelinated (axons: n = 85, 140, and 251; zebrafish: n = 3, 3, and 3; images: n = 10, 11, and 13 at 1.5, 2.0, and 3.0 months), and unmyelinated axon (axons: n = 432, 155, and 60; zebrafish: n = 3, 3, and 4; images: n = 10, 11, and 16 at 1.5, 2.0, and 3.0 months) diameter in zebrafish retinas at the age of 1.5 to 3.0 months. (D) A scatterplot of axon diameter versus G-ratio for myelinated axons in 1.5-, 2.0-, and 3.0-month-old zebrafish retinas. (E) Quantification of the thickness of myelin in zebrafish retinas (axons: n = 82, 67, and 144; zebrafish: n = 3, 3, and 4; images: n = 10, 11, and 16 at 1.5, 2.0, and 3.0 months). Scale bar: 200 nm.