
Fig. S8
- ID
- ZDB-IMAGE-160516-14
- Publication
- Ando et al., 2016 - Clarification of mural cell coverage of vascular endothelial cells by live imaging of zebrafish
- All Figures
- Figures for Ando et al., 2016
|
Fig. S8
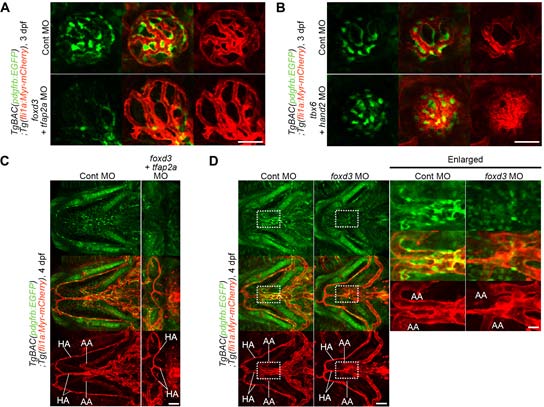
Investigation of the origin of MCs in the hyaloid vessels and the vessels in the pharyngeal region. (A) Confocal images of hyaloid vessels in the 3 dpfTgBAC(pdgfrb:EGFP);Tg(fli1a:Myr-mCherry) larvae injected with control MO (upper panels in A and B)or either both foxd3 and tfap2a MOs (lower panel in A) or both tbx6 and hand2 MOs (lower panel in B). Lateral view, anterior to the left. Left, pdgfrb:EGFP; center, the merged images of pdgfrb:EGFP (green) and fli1a:Myr-mCherry(red); right, fli1a:Myr-mCherry. (C, D) Confocal images of vessels in the pharyngeal region in the 4 dpfTgBAC(pdgfrb:EGFP);Tg(fli1a:Myr-mCherry) larvae injected with control MO(left columns in C and D) or eitherboth foxd3 and tfap2a MOs (right column in C) or foxd3 MO (right column in D). Top, pdgfrb:EGFP; middle, the merged images of pdgfrb:EGFP (green) and fli1a:Myr-mCherry(red); bottom, fli1a:Myr-mCherry.In D, the boxed areas are enlarged to the right. Note that foxd3/tfap2a-double morphant larva exhibited severe structural defects in the head, although it could form abnormal HA. AA, aortic arches; HA, hypobranchial artery.Scale bars, 20 µm (enlarged image in D) or 50 µm (A-E).