
Fig. S4
- ID
- ZDB-IMAGE-160516-10
- Publication
- Ando et al., 2016 - Clarification of mural cell coverage of vascular endothelial cells by live imaging of zebrafish
- All Figures
- Figures for Ando et al., 2016
|
Fig. S4
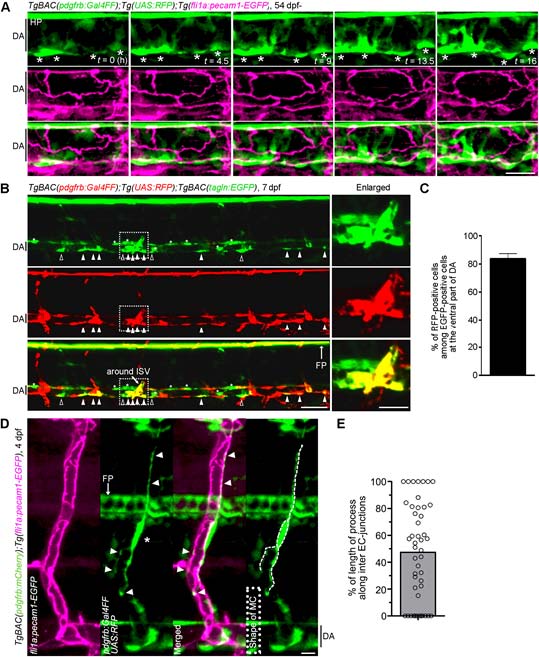
MC coverage of trunk axial vessels. (A) Time-lapse confocal images of MC coverage of DA. Confocal images of DA in the TgBAC(pdgfrb:Gal4FF);Tg(UAS:RFP);Tg(fli1a:pecam1-EGFP) embryo at 54 hpf(leftmost column) and subsequent time-lapse images with the elapsed time (h) at the bottom right. Top, pdgfr:Gal4FF;UAS:RFP(green); middle, fli1a:pecam1-EGFP (magenta); bottom, the merged images of pdgfr:Gal4FF;UAS:RFP(green) and fli1a:pecam1-EGFP(magenta). Asterisks indicate the cell body of MCs. Note that MCs located at the ventral side of DA extended multiple processes dorsally irrespective of inter EC-junctions. (B) Confocal images of trunk vasculature in the TgBAC(pdgfrb:Gal4FF);Tg(UAS:RFP);TgBAC(tagln:EGFP) larva at 7 dpf. Top, tagln:EGFP; meddle, pdgfr:Gal4FF;UAS:RFP; lower, the merged image of tagln:EGFP(green) and pdgfr:Gal4FF;UAS:RFP(red). The boxed areas are enlarged to the right. Open and closed triangles indicate the EGFP-positive and RFP-positive cells and the EGFP-positive and RFP-negative cells at the ventral side of the DA, respectively. Asterisks indicate the EGFP-positive and RFP-negative cells located in the dorsal and lateral side of the DA. (C) Percentage of RFP-positive cells among the EGFP-positive cells located at the ventral side of the DA, as observed in B. Data is mean ± s.e.m. (n = 15).(D) Confocal images of an ISV in the TgBAC(pdgfrb:mCherry);Tg(fli1a:pecam1-EGFP)larva at 4 dpf. Lateral view, anterior to the left. Leftmost panel, fli1a:pecam1-EGFP(magenta); second panel from the left, pdgfr:Gal4FF;UAS:RFP(green); third panel from the left, the merged image of fli1a:pecam1-EGFP image (magenta) and pdgfr:Gal4FF;UAS:RFP(green); rightmost panel, pdgfr:Gal4FF;UAS:RFP image in which MC shape is outlined by the dotted line. Arrowheads indicate the MC processes that aligned along with Pecam1-EGFP-labeled inter-EC junctions. Asterisk shows the MC body.(E) Alignment of MC processes along the inter-EC junctions as observed in Dis expressed as a percentage of the total length (n = 47). Bar and circles indicate the average and the values of individual process, respectively.In this figure, all images are shown in lateral view with anterior to the left.Scale bars; 20 µm (D,enlarged image in B)or 50 µm (A,B).DA, dorsal aorta; HP, hypochord; FP, floor plate.