
|
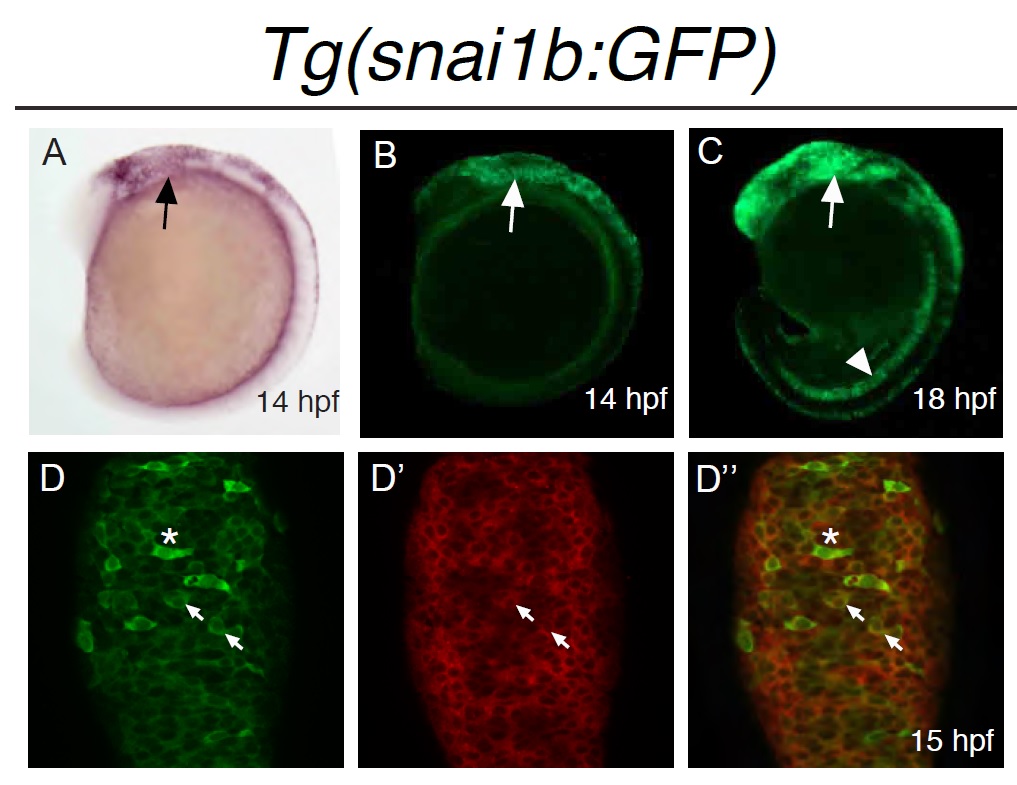
Fig. S1
Expression of Tg(snai1b:GFP) During NC Development. Lateral views of (A) snail1b mRNA in situ hybridization compared to (B) GFP expression in Tg(snai1b:GFP) showing GFP-positive cells in cranial NC at 14 hpf (arrow). (C) By 18 hpf, GFP expression can be seen in the notochord (arrowhead) and within a subset of cranial NC streams (arrow). (D) Confocal maximal projection (4 µm) of dorsal view of hindbrain region in Tg(snai1b:GFP) embryos at 15 hpf processed for whole mount in situ hybridization of snail1b mRNA (red, D′) and immunofluorescence of GFP protein (green, D). Arrows highlight examples of co-localization between snail1b mRNA and GFP-positive cells in D′′. Cells expressing the highest leves of GFP (asterisk) apear mesenchymal and express decreased levels of snail1b mRNA.