
|
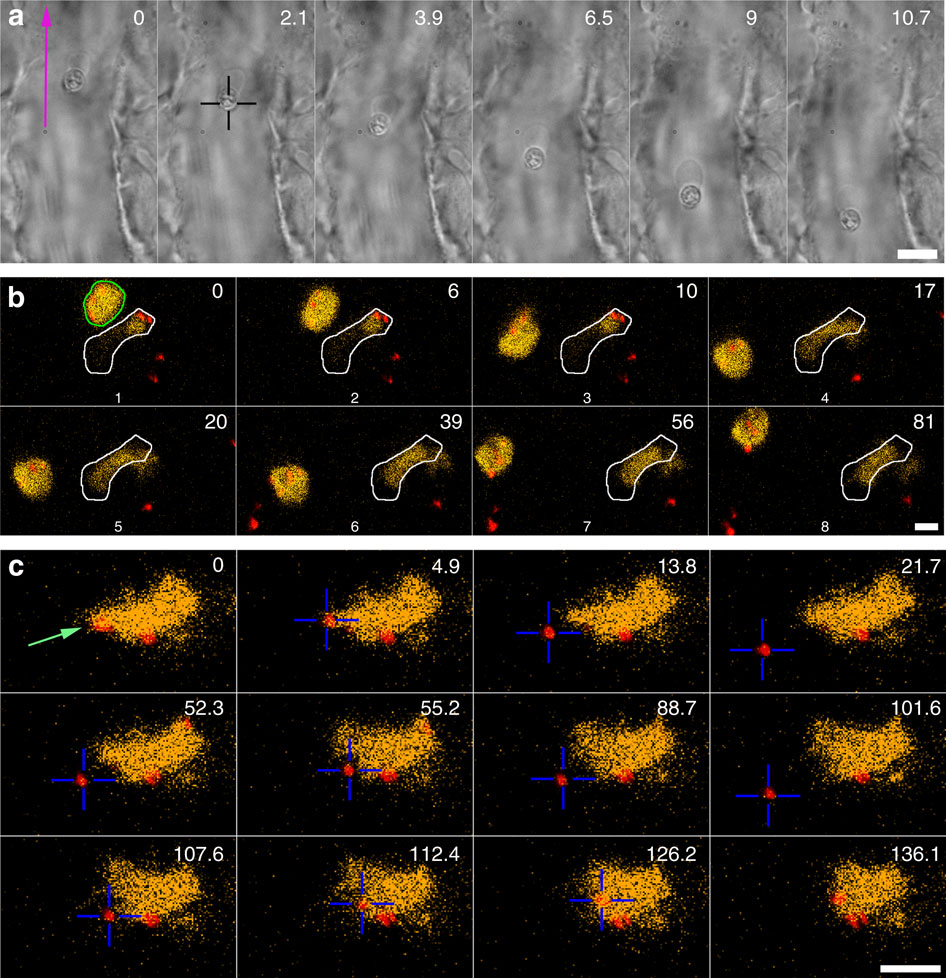
Fig. 2
rapping of erythrocytes and macrophages. (a) An erythrocyte is trapped and moved in the blood flow. Scale bar, 10 µm. Experiment repeated at least 10 times. (b) A blood-resident fluorescent macrophage (yellow, green outline in t=0 s) was micromanipulated and moved in 3D in a blood vessel. The white outline indicates another, non-mobile macrophage. The red dots are injected particles. Scale bar, 5 µm. Experiment repeated at least 5 times. (c) An injected particle (red colour) that was associated with a macrophage was tested for adhesion. First the particle was moved away (t=0-21.7 s) after which the OT was briefly shut off. This did not result in the particle flowing away with the blood, suggesting that a nanotube (not visible) was tethering the particle; next the particle was carefully brought into contact and moved away again (52.3-101.6 s), indicating that no strong binding was established. Finally, the particle was moved further into the macrophage with a higher pushing force after which the particle could not be detached anymore (t=107.6-136.1 s). Scale bar, 10 µm. Experiment was repeated at least 5 times.