
|
Fig. 4
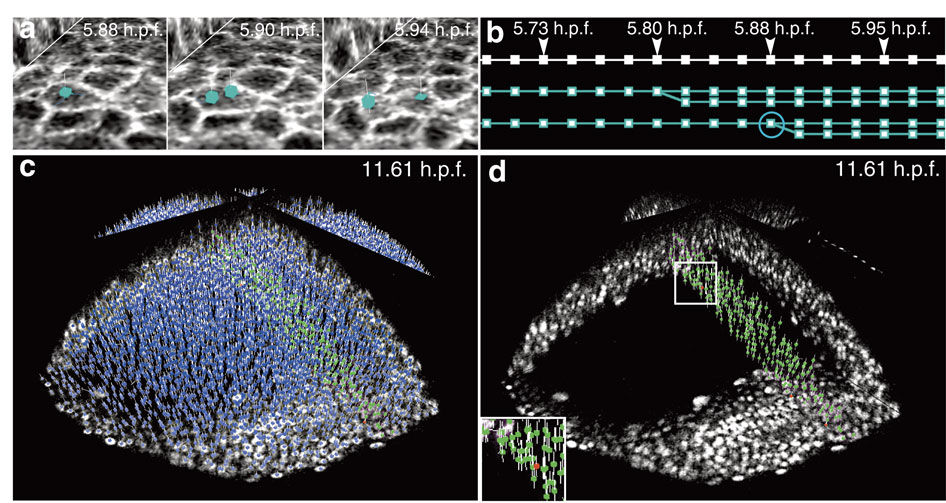
Visualization and validation of the lineage tree reconstruction (zebrafish dataset Dr1).
Results from the zebrafish data set Dr1. All screenshots taken from the Mov-IT visualization interface, then tagged. (a) Cell division illustrated by three snapshots; time in hours post fertilization (h.p.f.) indicated top right; cell centres (cyan cubes) and cell paths (cyan lines) superimposed on two raw-data orthoslices showing the membranes (grey levels). (b) Flat representation of the cell lineage tree for three cell clones over 17 consecutive time steps: each cell is represented by a series of cyan squares, linked according to the cell’s clonal history; the cell dividing in Fig. 4a is circled. (c,d) Nucleus centre detection in a subpopulation of cells chosen at 11.61 h.p.f. Mov-IT visualization in ′checking mode′ adding short vertical white lines to the detected centres, and displaying correct nuclei in green and false positives in red; (c) all detected nuclei; (d) validated nuclei only.