
Fig. S3
- ID
- ZDB-IMAGE-160317-39
- Publication
- Liu et al., 2016 - Cannabinoid receptor signaling regulates liver development and metabolism
- All Figures
- Figures for Liu et al., 2016
|
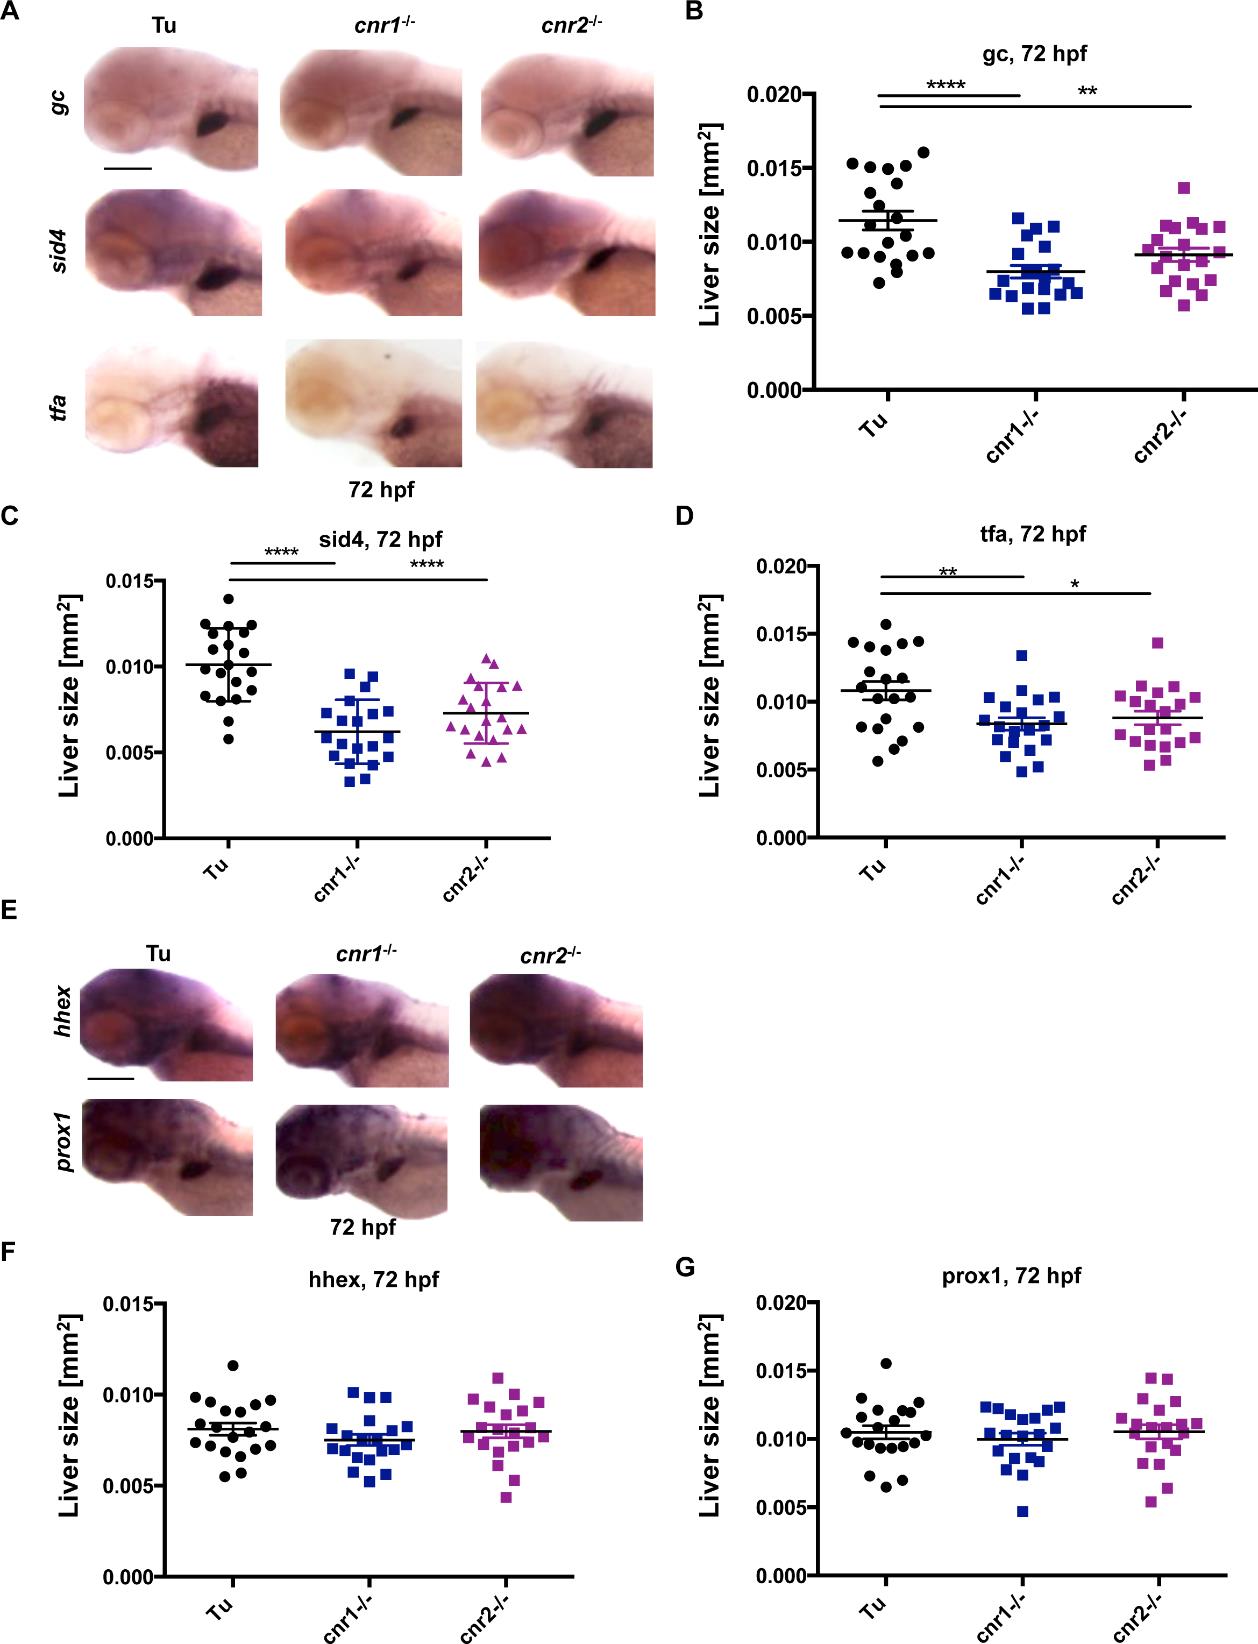
Fig. S3
Examination of additional hepatic markers in cnr1-/- and cnr2-/- mutants
A) Representative in situ hybridization images and scatter plots quantifying (B-D) expression of additional hepatocyte markers in cnr1-/- and cnr2-/- mutants at 72hpf. Expression of group specific component (vitamin D binding protein, gc), secreted immunoglobulin domain 4 (sid4), and transferrin (tfa) were all reduced in cnr1-/- and cnr2-/- mutants. These results confirm smaller liver size and exclude a dependence on fabp10a expression when cannabinoid receptors are knocked out in these mutants. Data are represented as mean±s.e.m. with one-way ANOVA analysis. Results shown represent one independent experiment of triplicate experiments which yielded similar results, n >15 for each experiment, *p<0.05, **p<0.01, ***p<0.001, ****p<0.0001. Scale bar = 0.2 mm.
E) Representative in situ hybridization images and scatter plots quantifying (F-G) expression of hepatic progenitor markers hhex and prox1 at 72hpf. Hepatic progenitors remain unchanged in cnr1-/- and cnr2-/- mutants at 72hpf. These data indicate that disruption of signaling through cannabinoid receptors impacts hepatic differentiation. Data are represented as mean±s.e.m. with one-way ANOVA analysis. Results shown represent one independent experiment of triplicate experiments which yielded similar results, n >15 for each experiment, p=0.42 and p=0.68 for hhex and prox1, respectively. Scale bar = 0.2 mm.