
|
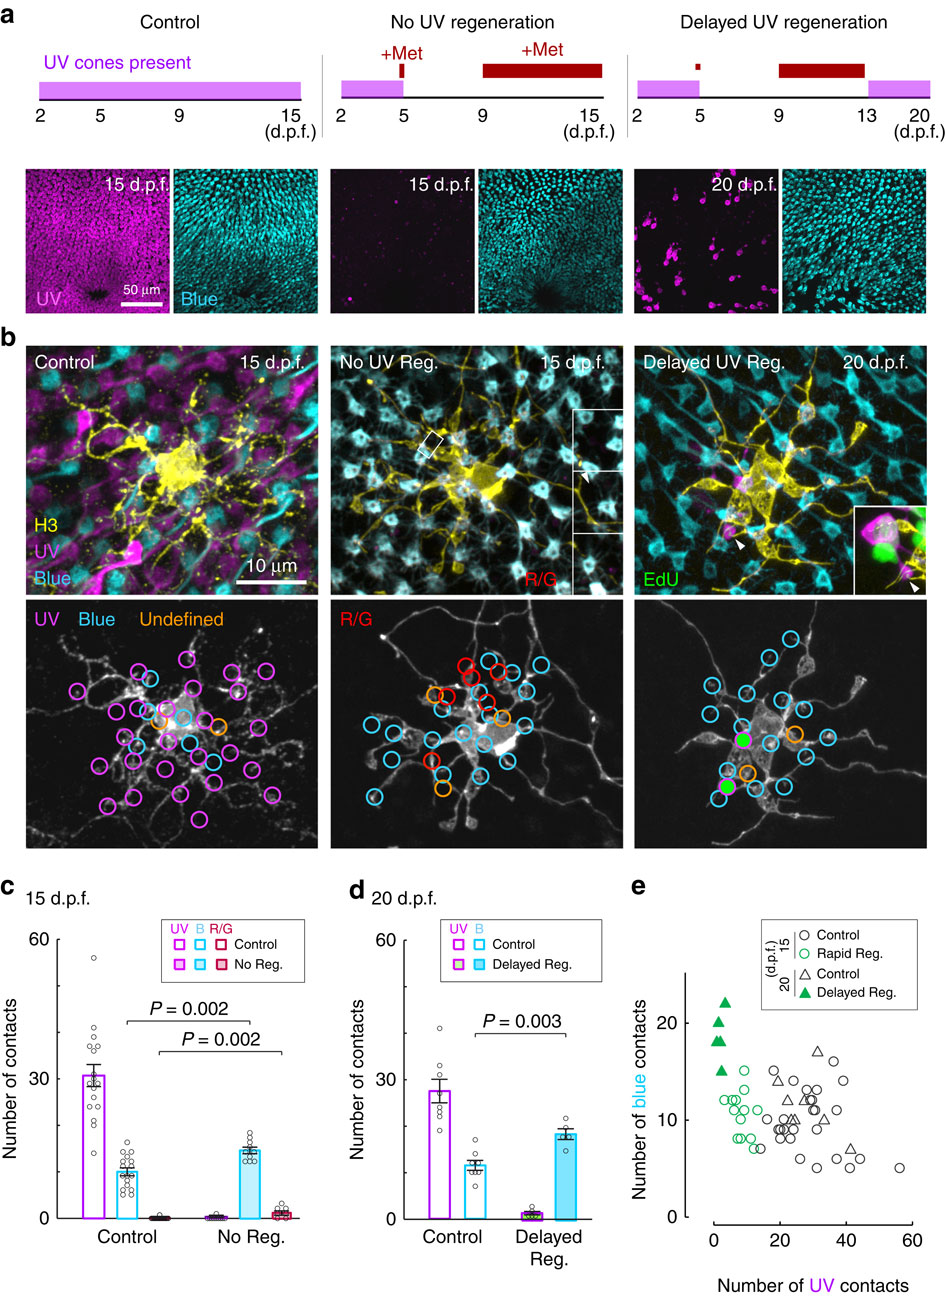
Fig. 5
H3 HCs synapse with blue cones and other cone types when ultraviolet cones fail to regenerate.
(a) Schematic showing period of metronidazole (Met) treatment (red lines) and ultraviolet-cone presence in the retina (magenta bars). Images show distribution of ultraviolet (magenta) and blue (cyan) cones in the whole-mount retina at the end of the treatments. (b) Examples of an H3 HC in control retina, in a retina with no ultraviolet regeneration (No UV Reg.) and in a retina with delayed regeneration (Delayed UV Reg.). Inset for the no regeneration example shows sideview of a dendritic tip (arrowhead) in the boxed region contacting a zpr1-positive red or green cone (R/G, shown in red). Inset for the delayed regeneration example shows contact with a new (EdU+, green) ultraviolet cone. (c,d) Measurements across H3 HC populations; circles are measurements from individual cells. Error bars are s.e.m. Mann-Whitney rank-sum test. (e) Comparison of the number of ultraviolet- versus blue-cone contacts for individual H3 cells in control and regenerated conditions. UV, ultraviolet. B, blue.