
|
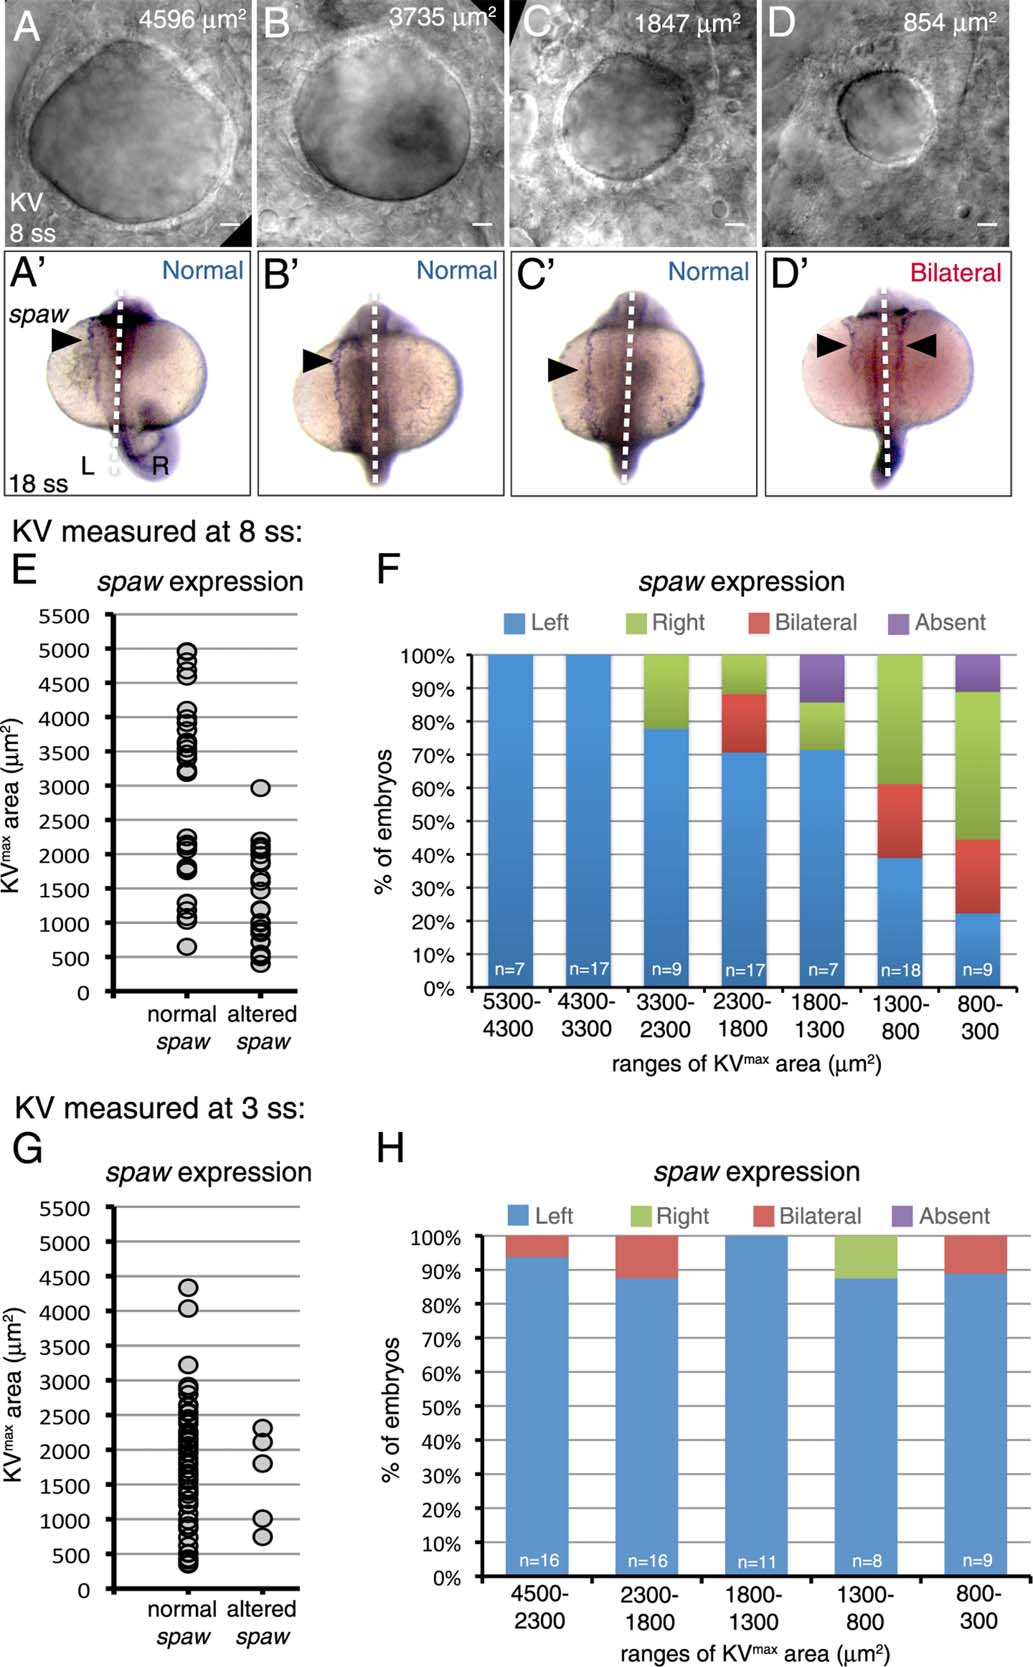
Fig. 4
Identification of a Kupffer′s vesicle size threshold necessary for robust LR patterning. A–D: Representative DIC images of different sized KVs in living wild-type embryos at 8 ss. The KVmax area is indicated for each representative embryo. (A′-D′) spaw expression (arrowhead) at 18 ss in the same embryos. Dashed lines indicate the embryonic midline. L = left; R = right. E–H: Analysis of spaw asymmetry in embryos in which KV was measured at 8ss (E,F) or 3 ss (G,H). E,G: Normal (left-sided) and altered (bilateral, reversed or absent) spaw outcomes were plotted based on KVmax area. Each point represents a single embryo. F,H: Observed spaw expression in embryos within specific ranges of KVmax areas. N = number of embryos analyzed.