
|
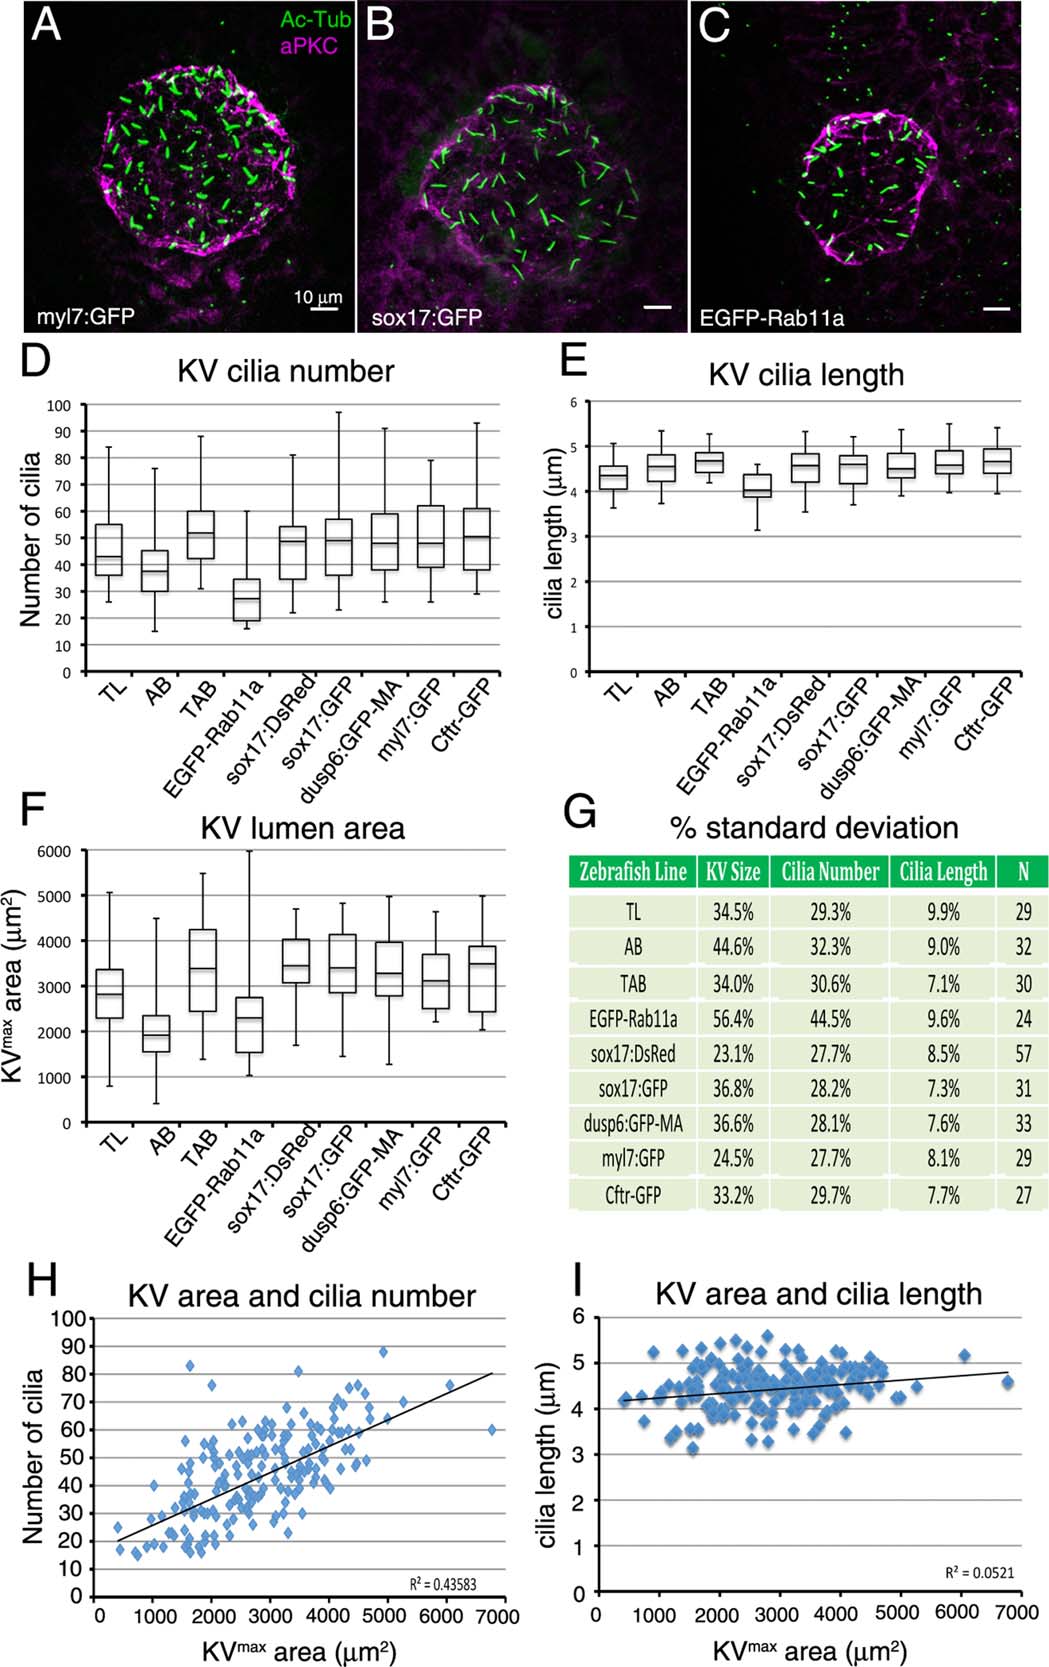
Fig. 2
The amount of variation in Kupffer′s vesicle development is similar among different wild-type and transgenic strains. A–C: Images of KV at 8 ss from three different transgenic strains. KVs appeared similar in most strains, including Tg(myl7:GFP) (A) and Tg(sox17:GFP) (B), but were smaller inTg(h2afx:EGFP-rab11a) (C). See text for descriptions of each strain. D–F: Analysis of KV cilia number (D), cilia length (E), and lumen area (F) at 8 ss for different wild-type (TL and AB) and several transgenic strains. Data from wild-type TAB strain at 8 ss presented in Figure 1 are included for comparison. The number of embryos (N) analyzed for each strain is indicated in (G). G: Variations in cilia number, cilia length, and lumen size are represented as one standard deviation as a percentage of the mean. H,I: Analysis of potential correlations between KV lumen area and cilia number (H) and KV lumen area and cilia length (I). Each point represents a single embryo (n = 292 embryos). The R2 (coefficient of determination) value is listed for all strains pooled.