
|
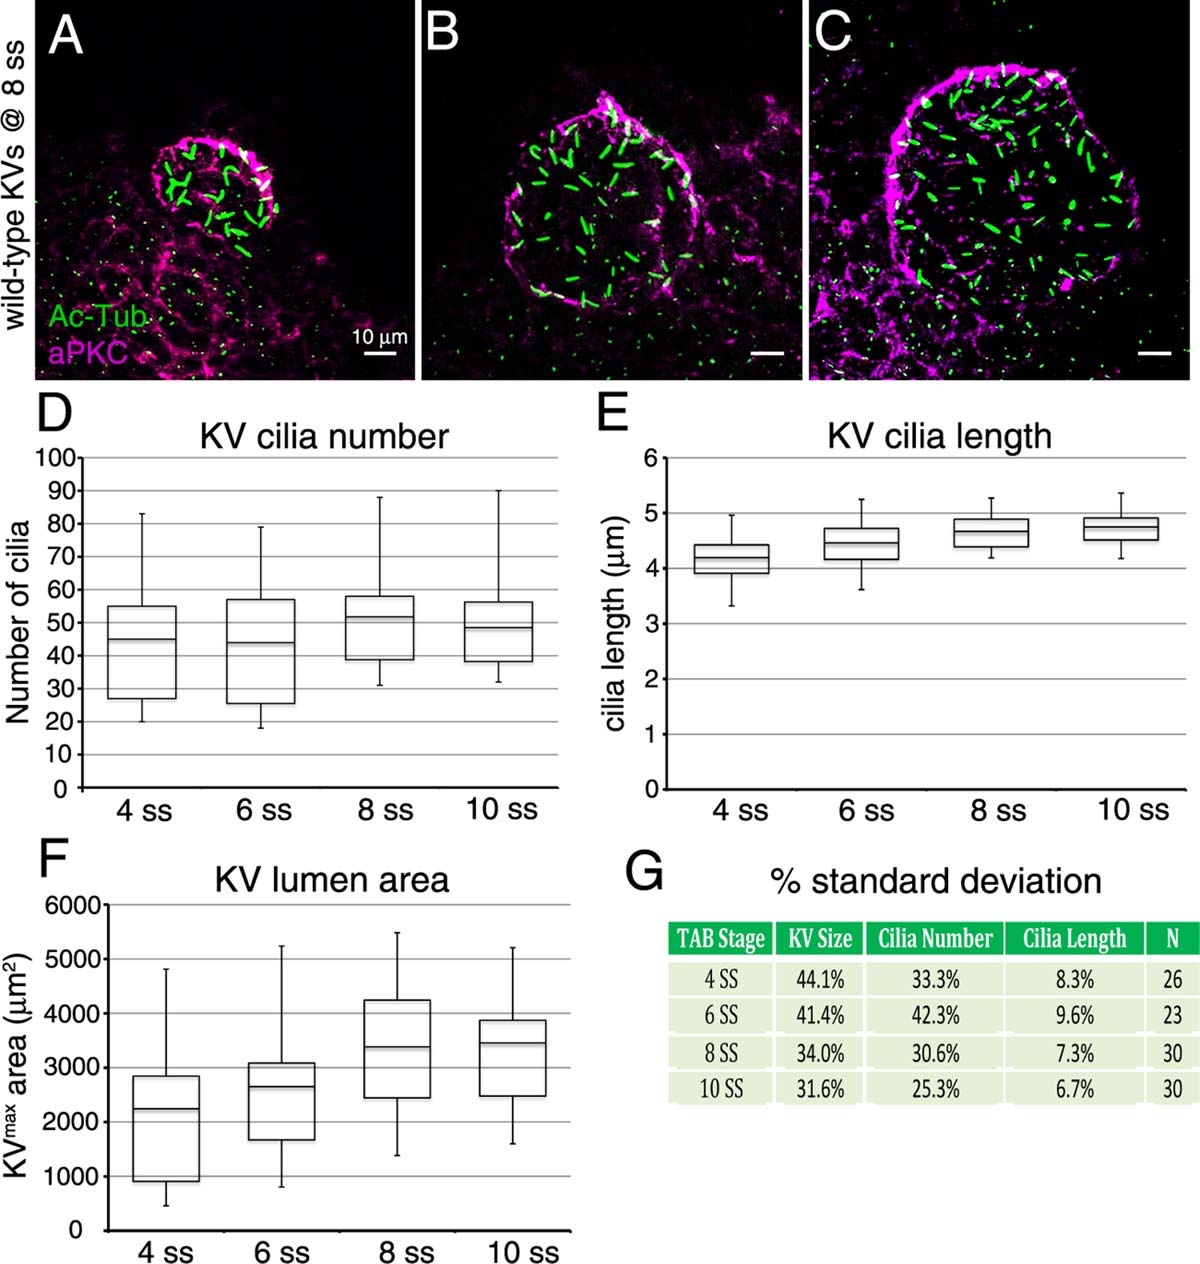
Fig. 1
Analysis of variation in development of Kupffer′s vesicle in wild-type embryos. A–C: Representative maximum projections of confocal images of KV cells labeled with aPKC antibodies (magenta) to mark the KV lumen and acetylated Tubulin antibodies (green) to visualize cilia at 8 ss. These examples show a TAB wild-type embryo with small KV size and few cilia (A) and embryos with an intermediate (B) or larger (C) lumen size. D–F: Quantification of KV cilia number (D), cilia length (E), and lumen area (F) at 4 ss (n = 26 embryos), 6 ss (n = 23), 8 ss (n = 30), and 10 ss (n = 30). The horizontal line in the box and whisker plots indicates the mean and the whiskers show the minimum and maximum values. G: Variations in cilia number, cilia length, and lumen size at each developmental stage are represented as one standard deviation converted to a percentage of the mean.