
|
Fig. 2
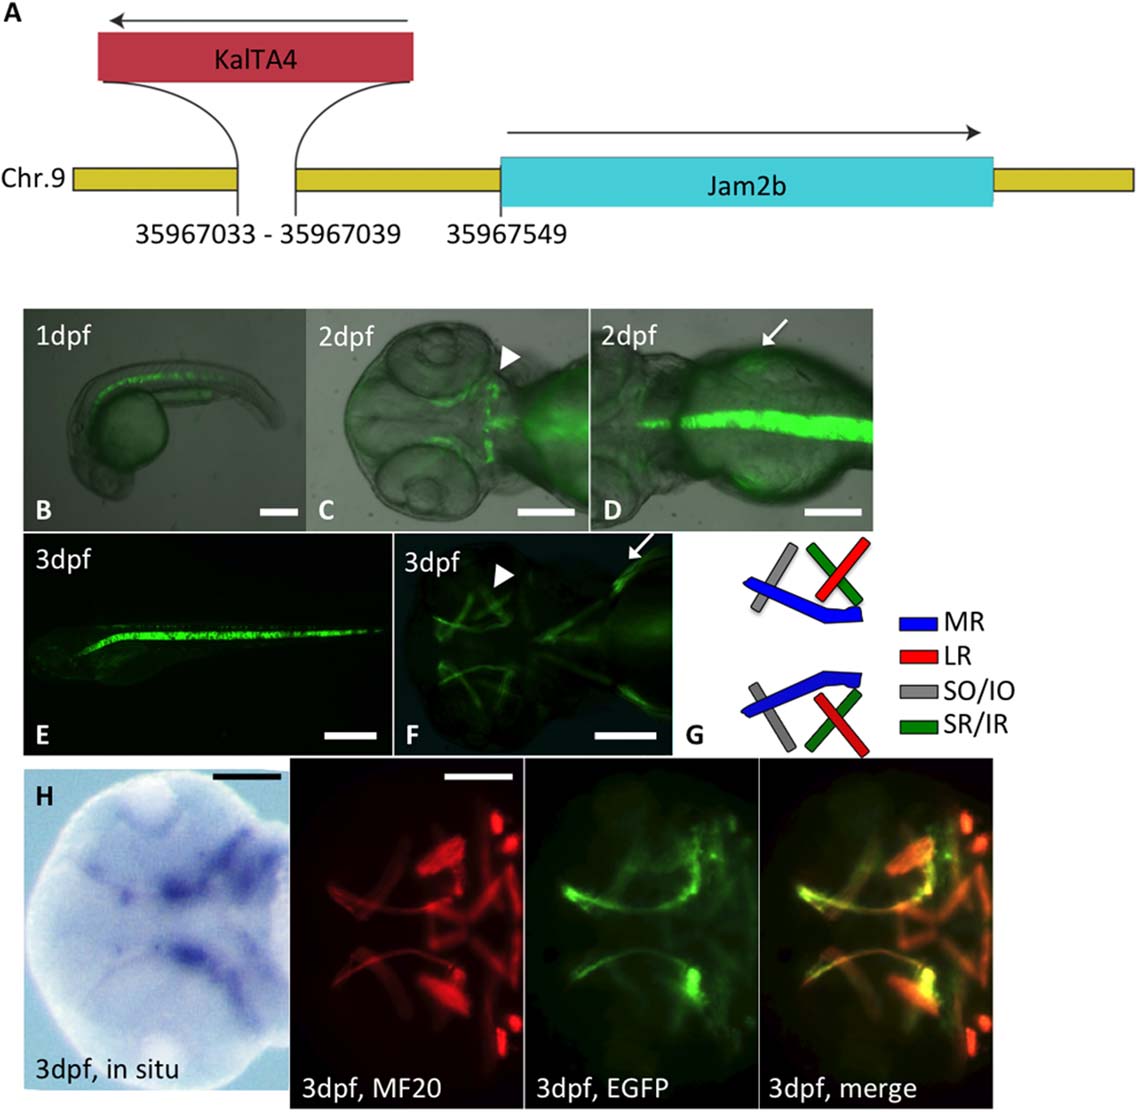
Transactivation of EGFP expression by jamb2bz1Et enhancer trap line in EOMs, jaw muscles, and pectoral fins. A: Schematic illustration of the chromosomal KalTA4 insertion locus in the jamb2bz1Et enhancer trap line. KalTA4 was inserted by Gal4 enhancer trapping into chromosome 9: base pairs 35,967,033 to 35,967,039. This site locates 544 base pairs upstream of the jam-b2 open reading frame. B: EGFP signal at 1 dpf. Note that the expression in the notochord (and some nonneuronal spinal cord cells at 3 dpf, Fig.2E) is due to the twhh promoter sequence used as basal promoter in front of KalTA4 in the trapping construct (Distel et al., 2009; scale bar = 250 µm). C,D: EGFP fluorescence at 2 dpf. jam-b2 enhancer mediated KalTA4-expression drives EGFP expression in EOMs (C, arrowhead) and pectoral fins (D, arrow; scale bar = 150 µm). E,F: EGFP signal at 3 dpf. Arrowhead: EOMs. Arrow: pectoral fins (E: scale bar = 500 µm, F: scale bar = 200 µm). G: Schematic illustration of EOMs in zebrafish. LR: lateral rectus, MR: medial rectus, SO: superior oblique, IO: inferior oblique, SR: superior rectus, IR: inferior rectus. H: Colocalization of EGFP signals with the signals of MF20 muscle specific antibody. For comparison, in situ signal shown in Figure 1B1 is again presented on the left (scale bar = 200 µm).