
Fig. 1
- ID
- ZDB-IMAGE-160210-24
- Publication
- Chiavacci et al., 2015 - MicroRNA 19a replacement partially rescues fin and cardiac defects in zebrafish model of Holt Oram syndrome
- All Figures
- Figures for Chiavacci et al., 2015
|
Fig. 1
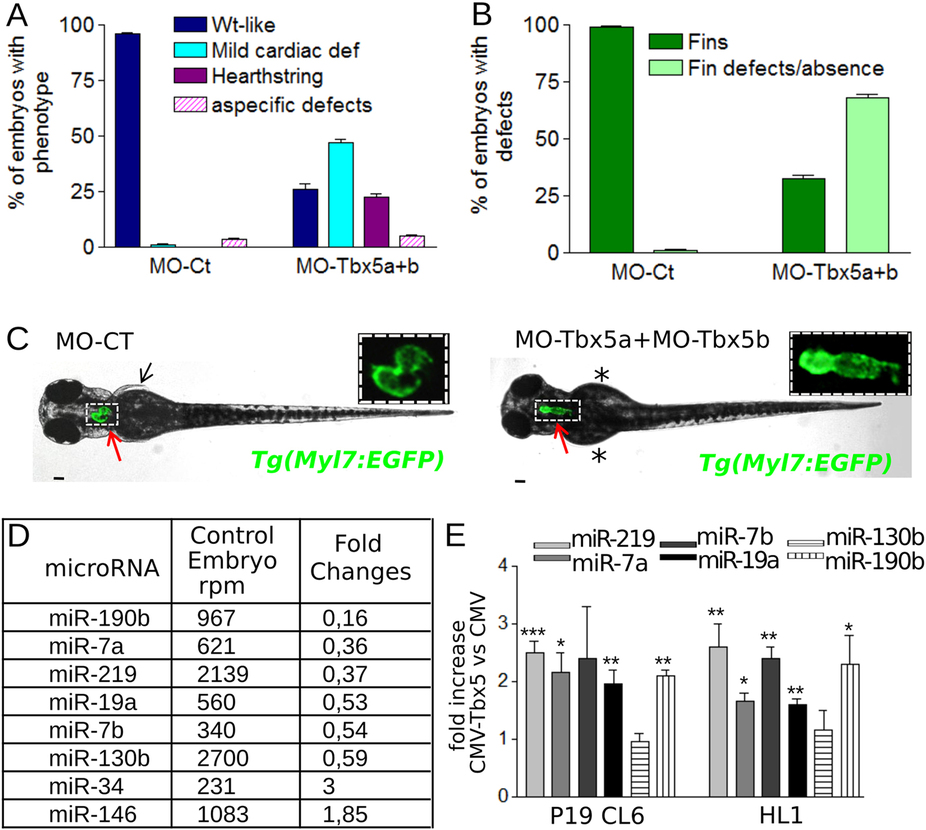
Tbx5a/b downregulation dysregulates miRNA expression during zebrafish development.
(A,B) Cardiac (A) and fin (B) analysis of 72 hpf embryos injected with 3 ng of MO-Ct or 1.5 ng of MO-Tbx5a and 1.5 ng of MO-Tbx5b. (C) Images representative of WT-like and heartstring Tg(Myl7:EGFP) morphants at 72 hpf. Red and black arrows point to heart and fins, respectively. Stars mark fin absence. Scale bar 100 µm. Heart higher magnification in insets. (D) List of miRNAs that showed a positive or negative fold change e1.8 and a number of reads per million (rpm) higher than 200 in the Tbx5 depleted embryos (MO-Tbx5a + MO-Tbx5b). (E) QRT-PCR analysis of mouse P19CL6 proliferating cells or HL1 cells 48 hrs after transfection with Tbx5 expressing vector or with an empty vector. t-test was used for statistical analysis.