
|
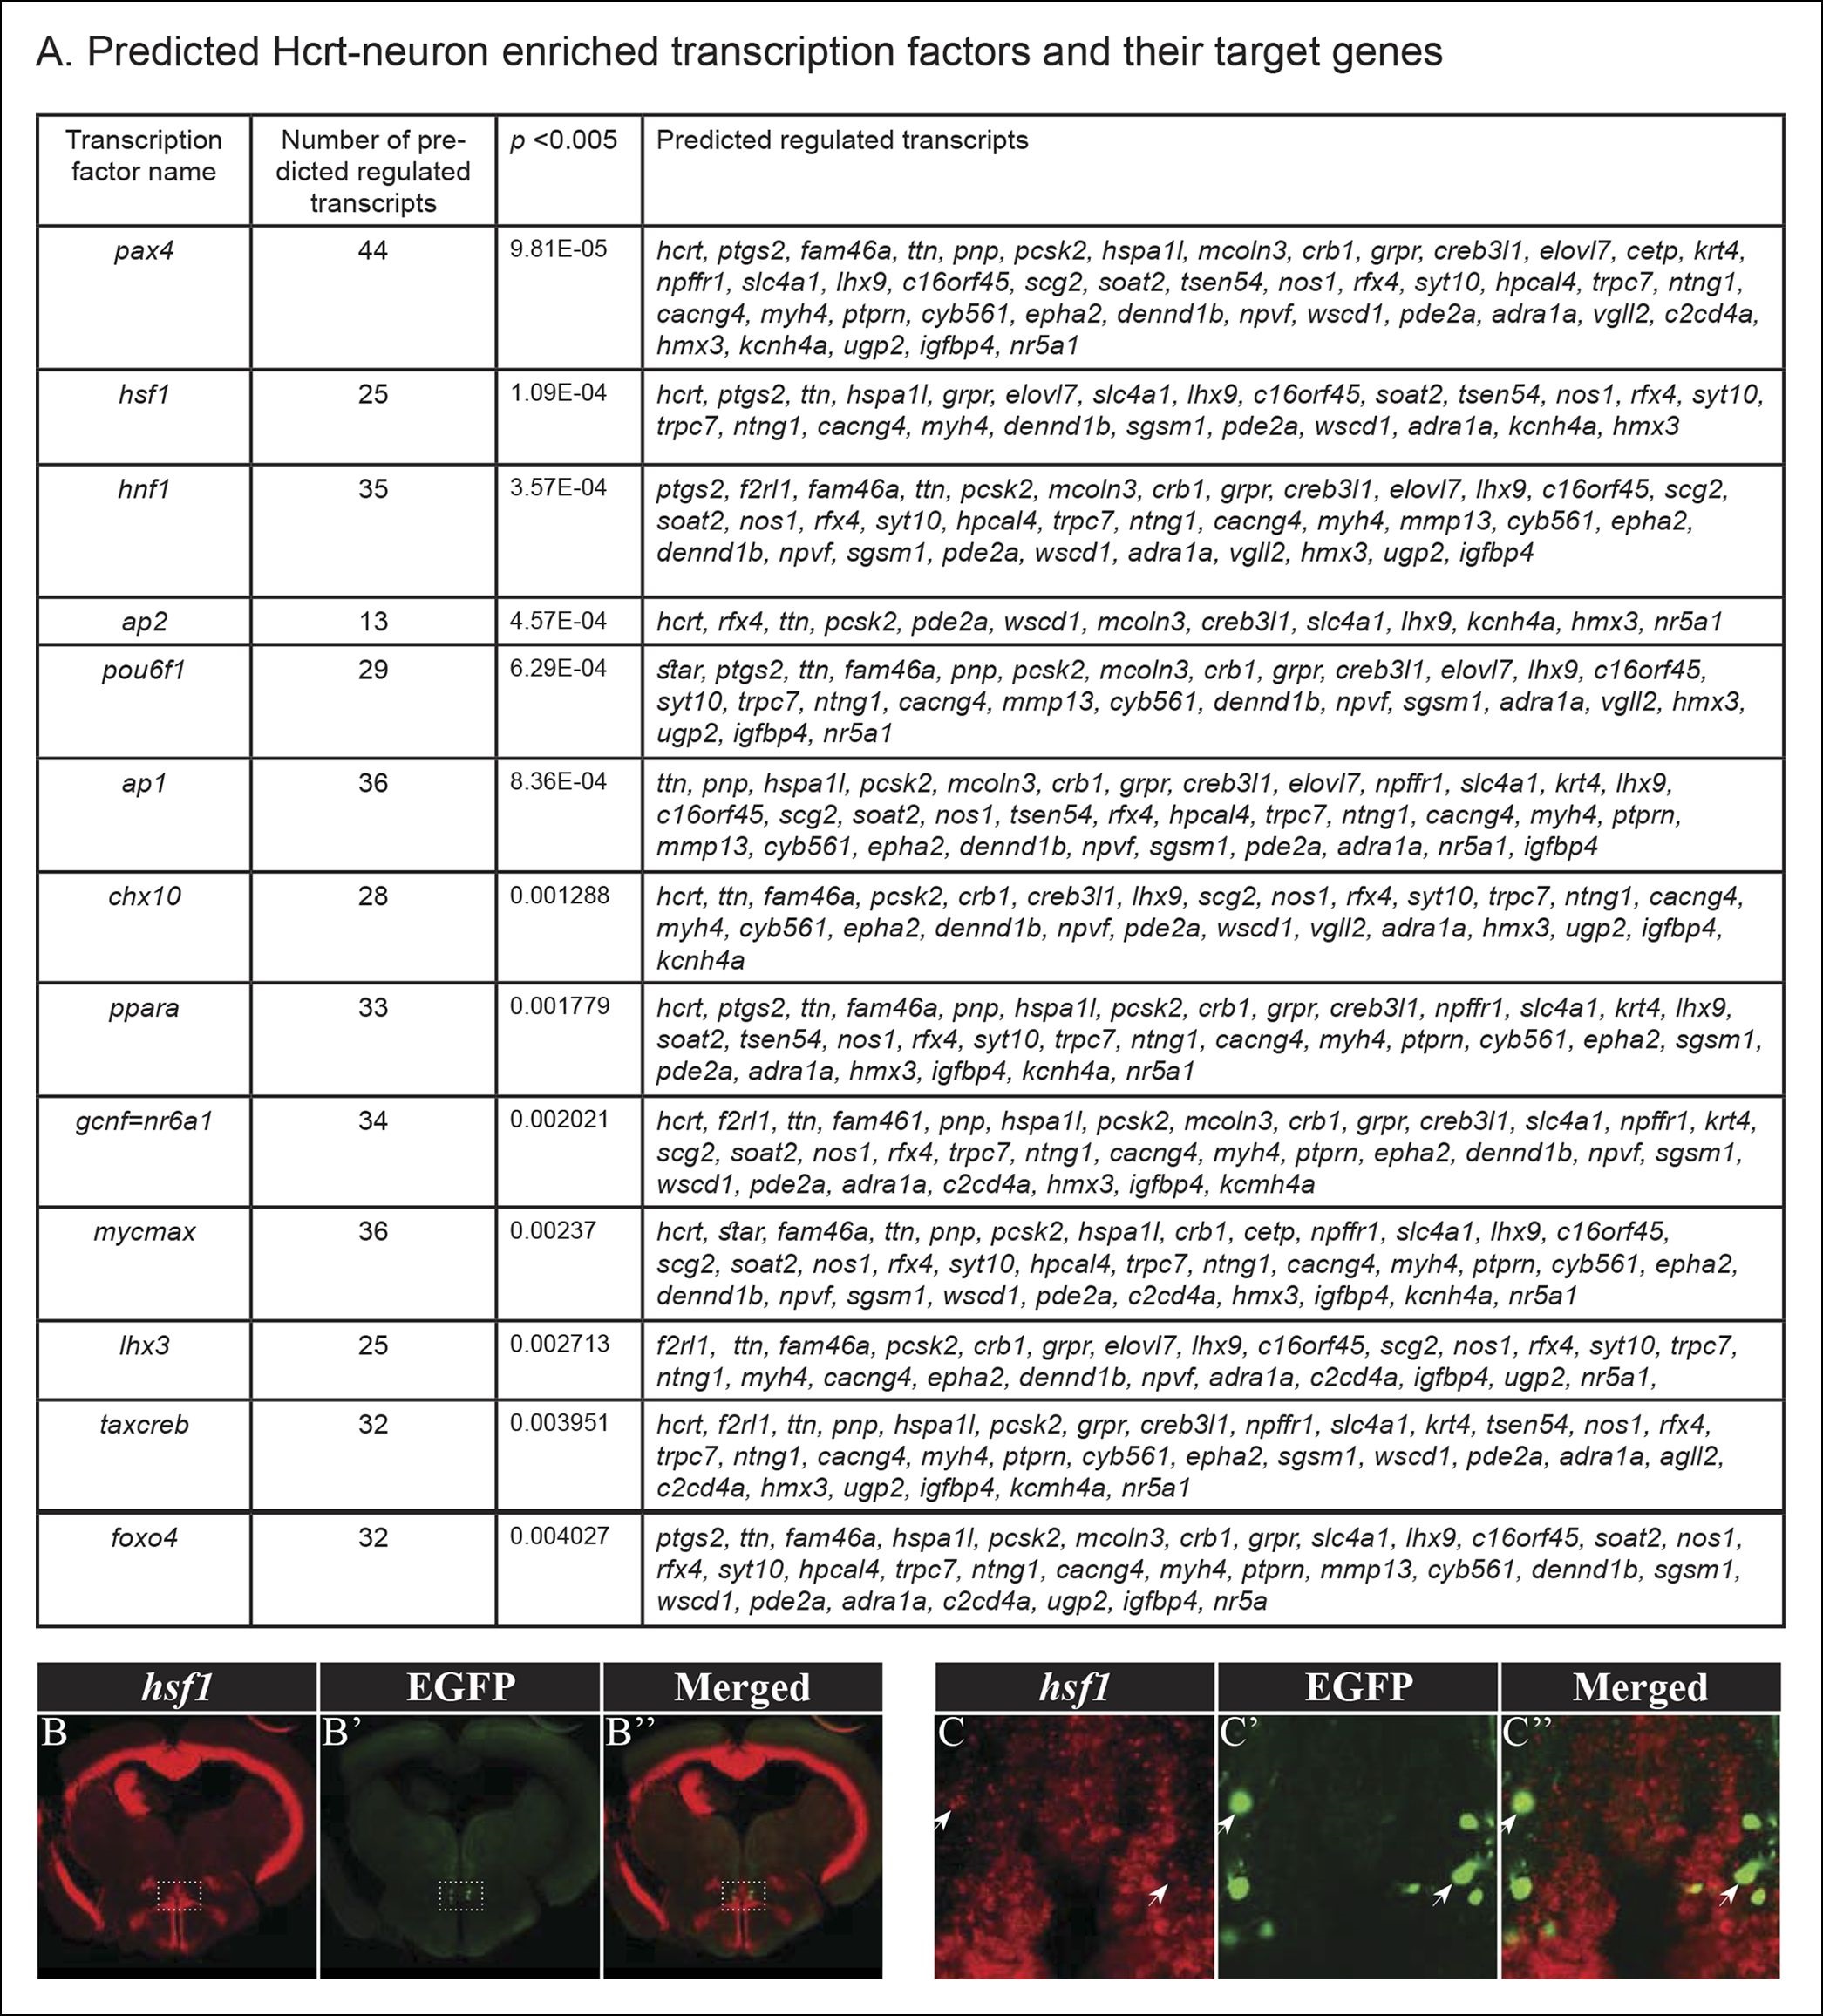
Fig. 5
Predicted TFs that regulate the expression of Hcrt-neuron–specific transcripts.
(A) TFs with a p <0.005 and their target Hcrt-neuron–specific genes. For each of these transcription factors, a combined score for each gene is calculated according to all of the predicted binding sites in its promoter. Therefore, a gene with an overrepresented binding site of a TF will have a high score for that TF and a lower p value. (B–C′′) Double fluorescent ISH of hsf1 and immunofluorescence staining of EGFP in hcrt:EGFP adult brain section. Single plane (0.5 µM width) view of the Hcrt-neuron region (C–C′′). Arrows mark representative EGFP and hsf1 co-expressing cell.